
Recommendation
Silica coating developed in cave art walls had an impact in the preservation of the paintings themselves. Despite it still exists a controversy about whether or not the effects contribute to the preservation of the artworks; it is evident that identifying these silica coatings would have an impact to assess the taphonomy of the walls and the paintings preserved on them. Unfortunately, current techniques -especially non-invasive ones- can hardly address amorphous silica characterisation. Thus, its presence is often detected on laboratory observations such as SEM or XRD analyses. In the paper “Light in the Cave: Opal coating detection by UV-light illumination and fluorescence in a rock art context - Methodological development and application in Points Cave (Gard, France)”, Quiers and collaborators propose a new method for the in situ detection and characterisation of amorphous silica in a rock art context based on UV laser-induced fluorescence (LIF) and UV illumination [1].
The results from both methods presented by the authors are convincing for the detection of U-silica mineralisation (U-opal in the specific case of study presented). This would allow access to a fast and cheap method to identify this kind of formations in situ in decorated caves. Beyond the relationship between opal coating and the preservation of the rock art, the detection of silica mineralisation can have further implications. First, it can help to define spot for sampling for pigment compositions, as well as reconstruct the chronology of the natural history of the caves and its relation with the human frequentation and activities. In conclusion, I am glad to recommend this original research, which offers a new approach to the identification of geological processes that affect -and can be linked with- the Palaeolithic cave art.
[1] Quiers, M., Chanteraud, C., Maris-Froelich, A., Chalmin-Aljanabi, E., Jaillet, S., Noûs, C., Pairis, S., Perrette, Y., Salomon, H., Monney, J. (2022) Light in the Cave: Opal coating detection by UV-light illumination and fluorescence in a rock art context. Methodological development and application in Points Cave (Gard, France). HAL, hal-03383193, ver. 5 peer-reviewed and recommended by Peer community in Archaeology. https://hal.archives-ouvertes.fr/hal-03383193v5
DOI or URL of the preprint: https://hal.archives-ouvertes.fr/hal-03383193v3
Version of the preprint: version 3
We would like to thank the reviewers for their last comments on our work and for all the reveiw process which really improved our manuscript. We submitted a new version with the minor changes proposed and some corrections of errors we could find during the last reading.
We hope this version will correspond to the reviewers expectations.
Regards,
The authors
Dear authors,
As you had the opportunity to read in the Round #2 of revision, both reviewers are very satisfied with the changes implemented in your original manuscript. However, Laure Dayet still arose a couple of minor details that can be corrected. I feel that it would be better that those couple of passages are changed before accepting a final version of the manuscript, rather than try to modify them once the pre-print will be already recommended. Thus, I would ask you to address those issues before I write my final recommendation which, as you can imagine based on the reviews, is going to be positive.
Kind regards,
Aitor Ruiz-Redondo
 , 21 Mar 2022
In this second version, authors mainly answered to my detailed concerns about this manuscript that did not suffer, even in the first version, of serious flaws. This second version is therefore, in my opinion, better than the first one, which was already very good. Authors also improved the Supplementary Information section, while the code and data are still being shared.
I would like to thank the authors of the manuscript « Light in the Cave: Opal coating detection by UV-light illumination and fluorescence in a rock art context. Methodological development and application in Points Cave (Gard, France) » for their kind reply to my comments. They propose in their reply significant arguments in favor of their interpretation, the hypothesis that UV signal of uranyl groups is an index of the presence of opal. I do not doubt their interpretation. I would just recall them that this interpretation is a hypothesis in the paper. There is a crucial part in their manuscript where this interpretation first arises, that is Part 4.3 “Opal identification by UV-fluorescence”. They use a single short sentence to present this interpretation at first:
Line 281-283: “Absence of uranyl characteristic peaks on μ-S-ECA-03 can be attributed to the low opal occurrence on its surface as observed with SEM.”
This sentence is followed by a long development of the UV characteristics of opal with a review of the literature, which is very important in the paper. I would suggest this first sentence to placed at the end of the argumentation, with some additional information, after the reader has learned everything needed for a good understading of opal UV-fluorescence.
There might be a mistake in the sentence line 365-367: “The other loadings correspond to the contribution of different fluorescence parts in the spectra related to the matrix fluorescence (loading 2) and to some specific highly intense signals at the sample surface (loading 1), probably due to particular minerals.” Loading 2 should be loading 3.
These are my sole and minor comments to this very detailed and meaningful paper.
DOI or URL of the preprint: https://hal.archives-ouvertes.fr/hal-03383193v5
Dear authors,
Thank you for your submission to PCI Archaeology. As you can see, up to four reviewers have accepted my request to review your manuscript. Despite all of them are very positive, some highlighted a few details and shortcomings that deserve your attention. Thus, the reviewers recommend reconsideration of your manuscript following revision and modification. I kindly invite you to resubmit your manuscript after addressing the comments. Please, pay special attention to the remaks made by Laure Dayet and Alain Queffelec, as they highlighted a number of specific issues that should be adressed.
PCI Archaeology values your contribution and I really look forward to receiving your revised preprint.
Kind regards,
Aitor Ruiz-Redondo
The work specifically addresses the problem related to the formation of certain types of concretions formed on rock art, given their eventual impact on dating carried out using the U / Th method. The work presents very concretely a novel in situ, non-invasive methodological approach to identify these silica-rich concretions. The work is very systematic and clear. It is very well-structured and easy to understand. The literature cited and consulted is adequate and very well supports the study issue and methodological proposal presented, which is also very rigorous and of high quality. For all these aspects, in addition to the disciplinary contribution and relevance in terms of the results obtained, its publication is suggested.
Review of Quiers et al. “Light in the Cave: Opal coating detection by UV-light illumination and fluorescence in a rock art context”
The paper “Light in the Cave: Opal coating detection by UV-light illumination and fluorescence in a rock art context” presents in-depth observation and measurements of UV radiation of siliceous materials. I have been impressed by the quality of the data presented. The paper is well structured and the results are consistent enough for publication. The methodology used is reliable and the text is quite clear and straight forward. My only concern is the high number of sentences that present green light UV-fluorescence as a clear pattern for the detection of opal occurrences. In the paper the demonstration that uranyl groups do characterize the green light UV-fluorescence at the microscopic scale is fully achieved. However, two other working hypotheses elaborated in the paper are not fully demonstrated yet: the fact that uranyl groups solely belong to opal and the fact that the green light UV fluorescence on the photographs of the panels solely belongs to opal or siliceous materials. We would like to see the fluorescence signal of a part of the wall where chemical and mineralogical analyses depict a total absence of opal and siliceous materials. In absence of such witness sample, the theoretical data about the UV-fluorescence colours of the compounds composing the cave wall should at least be given. This being said, the interest of this works makes no doubt as it proposes consistent leads of research for opal detection in rock art and for a better understanding of the formation of opal microfilms in the vicinity of the pictorial layers of rock paintings.
Detailed comments:
Line 78 : More references are required
Line 98: The reference is missing
Line 132: “in the sedimentary sequence”
Line 139-141: There is a problem with this sentence
Line 278-284: The authors jump a bit too fast to the conclusions. Further argumentation would be needed here. It has not been demonstrated that the uranyl groups come from opal and not from another silica structure. It must be demonstrated that in the micro-samples where uranyl peaks are observed, opal is the sole type of silica observed.
Line 355-356: The fact that green-light UV fluorescence is a feature of opal contents is a logical conclusion but the demonstration that this UV fluorescence light does belong to opal is not completely achieved. Here we would like to see a witness sample, a sample of the cave wall that do not contain opal at all or a sample of painting with a similar hematite pigment that do not contain opal at all.
Line 365-385: That’s a great job, I am impressed by the quality of this work, the demonstration that green light fluorescence under UV light correlates with the uranyl peaks is complete. There is just one small step that remains to be demonstrated: the fact that uranyl groups do belong to opal and not to other silica structures.
Line 398-399: What is the colour of UV fluorescence of the other minerals present at the surface of the cave wall? Why a green colour indicates the presence of opal instead of any other mineral? I would not be as affirmative as the author about the clear detection of opal from the photographs.
Line 452-454: Assertions presented here should be treated with more caution. As said by the author in the previous paragraph, the results presented are preliminary.
Line 593-594: The “further study is needed” expression has been employed numerous times in the manuscript. At this stage of the paper, it would be interesting to develop some leads of research. Stating “further study is needed” is not sufficient.
Line 632: Are you sure of this concentration limit? A concentration in U lower than 1 ppm must not be very common.
Line 668-674: This paragraph is very general, its place at the end of a section is not very appropriate. It would be better placed at the beginning of the section 5.5.
, 07 Dec 2021The manuscript entitled « Light in the Cave: Opal coating detection by UV-light illumination and fluorescence in a rock art context. Methodological development and application in Points Cave (Gard, France)” submitted by Marine Quiers et al. proposes a new method for detection and study of opal coatings in caves by means of UV fluorescence spectroscopy. Based on identification performed on samples and micro-samples, the authors confirm the possibility of in situ identification and therefore spatial distribution of such coatings directly on the cave walls. They summarize the importance of such studies and identifications of mineral phases for several problematics around rock art in caves.
This manuscript is very interesting and, in my opinion, could be improved with the following suggestions. These are mostly details, but the main recommendation would be to balance more effectively the information and hypothesis about opal coatings between the introduction and the discussion. Some information indeed arrive too late for the reader who reads the manuscript without having an idea of the reasons why such a nice methodology is developed.
Authors made a really nice effort in the open data and open code perspective. Integrating in a better way this data by calling the SEM images in the text, and describing a bit more the fluorescence files would benefit to the reader and would strengthen the manuscript.
Introduction:
The introduction is well constructed but could benefit from more context on the other studies about silica coatings and even about mineral modifications on cave walls. It would be interesting to have an idea of the types of geological environments in which silica coatings have been observed/studied, since the references cited are quite various in geography (Canada, Southeast Asia, Australia) but not very precise in terms of geology. The hypothesis for the origin of these coatings could also be mentioned in the introduction (as I confirmed later by reading the discussion which contains these hypothesis). The paragraph about in situ characterization of minerals on cave walls in a rock art context could also be improved by broadening the literature cited. The last paragraph of the introduction needs reworking since it is not very clear how it connects with the rest of the introduction. Especially the “environmental input” is mentioned twice here, but has not been very developed before, no origin for silica coatings has been proposed from the literature review. The “environmental input” could be more developed, so that the reader know what the “Natural activity”, which are the two first words of the introduction, is. What do the authors integrate in “weathering”? Does it integrate biological activity: fungus and bacteria, or also animals (bats, bears etc.)?
- Line 49: maybe add some work on the Cussac cave by Ferrier et al.
- Line 53: check on the order of citations, which should be in chronological order.
- Line 57: There is probably a bit more than Huntley 2012 on this subject. Works about phosphate minerals, different types of speleothems, manganese minerals, gypsum or other salts in coastal or arid environments etc.
- Line 61: “Hematite”, rather than “haematite, is the name of this mineral in the International Mineralogical Association (IMA) list of mineral, which is kind of the international standard for mineral names. It is also “hematite” in scientific papers related to it like “Blake R L , Hessevick R E , Zoltai T , Finger L W , American Mineralogist , 51 (1966) p.123-129, Refinement of the hematite structure”, on all main mineralogical websites (Webmineral, Mindat), and so on. Could you change “haematite” to “hematite” throughout the manuscript or explain why you do not follow the IMA? A research on Google Scholar shows that “hematite” is used more than 10 times over “haematite”, and so is if compared in Google Books (https://books.google.com/ngrams/graph?content=hematite%2Chaematite&year_start=1800&year_end=2019&corpus=26&smoothing=3&direct_url=t1%3B%2Chematite%3B%2Cc0%3B.t1%3B%2Chaematite%3B%2Cc0)
- Line 72: The few paragraphs before this one did not really explain the “key issue” that the silica skin formation is for rock art in general. It resembles more like a quite specific question on the contrary with few sites and authors mentioned so far. Even if this is probably an under-represented issue due to difficulties to identify it, I do not think that, at this stage of the manuscript, the authors have demonstrated the key importance of the phenomena. As stated in the comments about the discussion, the importance of the phenomena, and the reasons why it is important to study it, are located only in the discussion, and the introduction would benefit from integrating a bit of these too.
- Line 75 or 78: Probably there could be more works cited here than Huntley 2012. Especially since the authors mention the recent development of these in situ measurement and Huntley 2012 is now ten years old, and since, from its title, this article is not a review of in situ analyses on rock art thus not a very general citation to be solely used in this part of the introduction.
2- Material
There are minor comments for the Material text, but the main question arises from the Results part that uses samples not described in this part (Line 235 + PRM in Fig. 4)
- Line 110: “Grotte” misses a “s”.
- Line 111: this sentence needs rephrasing I think.
- Line 112: Does “imprints” encompasses the Ibex representations?
- Line 113: maybe call fig. 1 here, it would explain the fact that Figure 1 indicates Squares in the topography.
- Line 123-124: this may necessitate more developments since it is important to know that there is carbonate development on the same walls as silica skin.
- Line 132: I think “the sedimentary” would be better than “this sedimentary”.
- Line 135: is “investigations” an excavation? Were the coloured red flakes unearthed or found on the surface of the ground?
- Line 137: “by” instead of “under” would be better I think. This sentence would benefit from a more direct phrasing. The “covered on one side by colouring matter” is not really supported by Fig. 2 which is not that red at all. Is this sentence accurately describing the surface of the flakes?
- Line 137: is it possible to know which face was directed upwards and downwards at the time of excavation?
- Line 139-141: this sentence need reworking.
- Line 148: maybe “focused on” would be better than “centred about”. And it seems that “centered” is more common than “centred”
- Line 149: “taken” instead of “taking”.
- Line 150: I think “µ-sampling” would be better than “µ-sample” in this sentence.
- Line 150: In the Figure 2, the samples are labeled “µ-S” and here in the text “µS”. Please make it homogenous throughout the manuscript.
- Line 150: We can see a second µ-Sample in the Supplementary Information folder MEB-FEG-datas_S_ECA_05. Could you mention it in the text please?
- Line 151: the call to Figure 2 would be better at the end of the previous sentence.
- Figure 1: Both the 3D images need scale, at least an indication of the size of what we see. The map would benefit from some other geographic points like cities or other, and maybe a map of France to locate the cave. The reader have presently no idea of the actual size of the points and must rely on the topography to have an idea of the size of the Niche aux points. In the topography there is a typo of << vs. “ in the “U-shaped gallery” indication at the bottom right. Probably the scale and North arrow could be on the right of the topography, or closer to the indication”Door”, to separate it from the Ardèche Gorge 3D model since the scale and arrow are only for the topography. What is “(MNT: Kim Genuite)”? It could be explained in the caption maybe? Is the photography of the Niche aux Points an orthophotography?
- Figure 2: the “covered on one side by colouring matter” in the text (line 137) is not that clear on this figure. Would it be possible to add D-stretch treated images?
- Figure 2: just to check: is it normal that there are only 3 out of 5 flakes and µ-Samples? If so, please precise in the text line 136 that only 3 are shown or something similar.
3- Methods
The current Methods part is clearly written but would benefit from integrating other methodological paragraphs that are presented in the Results section. It would also be important that the authors make reference to the Supplementary Information files that they provide, and how to use them. Especially, the fluorescence data are not detailed and, by opening the folders, I do not know at all how to use them, in which software, what are the qeccd.txt files etc. A readme file in the .zip files on figshare would be helpful, and/or an explanation here in the Methods section.
- Line 174-177: You do not mention any carbon or metal coating of the samples. But you mention analysis in high-vacuum mode. Since the samples are not highly conductive, can you confirm that there is no mistake here, just to be sure.
4- Results
4.1 Macroscopic scale observations
- The reader does not really know what you are looking for in this sub-chapter 4.1, and it makes me underline these two points:
- Line 215: could you be more specific about the absence of mineralization? I guess you mean that there is no visible silica mineralization? But the sentence is not that clear, and, on Fig. 2 one obviously sees a lot of different mineralizations.
- Line 216: what do you mean by “not taken into account”? Taken into account for what?
- Line 220-222: Would it be possible to hypothesize that these calcium sulphates deposited on the wall after the falling of the flakes? Or it could have been removed from the flakes since they were on the ground?
- Line 220-222: Given that these lines describe first a state of knowledge in this cave, maybe these lines could be at the beginning of 4.1, before the results of silica film absence?
4.2 Microscopic scale observations
This section of the manuscript shows strong evidence of the presence of the opal coating, surely, but the text and the description of samples needs a reworking so that it becomes much easier to follow for the reader.
- Line 227: which flake µ-samples? All of them? Figure 3 shows only an image from µ-S-ECA-05 so in the text it would be important to write in full letter if all µ-samples showed the same thing. It would be the place to call your supplementary images (image 14 or 22 of µ-S-ECA-03 for example). SEM images from µ-S-ECA-02 does not show any obvious opal coating to me, or could you lead the reader to it?
- Could you explain why there no SEM images from µ-S-ECA-01 in the Supplementary Information folders? So that we do not think there is a mistake in the SI links. Or maybe there is a folder but the link is missing?
- SI Images from other µ-Samples that µ-S-ECA-05 show clearly that hematite plates are covering opal coatings. Could you show that in the Figure 3 also and mention it in the text? I think it could be important for relative chronology discussion. Even for µ-S-ECA-02 the hematite plates are spread on the wall flake in the same manner as the hematite plates on the opal spheres in µ-S-ECA-04 for example. So it really looks like hematite is posterior to opal formation.
- Line 228-230: This may be in the Discussion section instead of the Results section.
- Figure 3: from the Supplementary Information files, the Fig. 3-1 is not from µ-S-ECA-05 but this picture is in the µ-S-ECA-02 folder.
- Figure 3: you write here “hematite” and, in the rest of the paper, you write “haematite”. As proposed before, I would advise to use “hematite”.
- Line 235: Which samples from the decorated walls? You only mentioned samples from the flakes so far. Are there other samples that should be described in the Material section?
- Line 236 : What are “these samples”? All the samples from flakes? Samples coming from the decorated wall directly? If it is the other µ-samples from flakes, I would say that a) for µ-S-ECA-01 the reader cannot know since there is no SI folder, and b) for µ-S-ECA-02, I did not see opal spheres in the SI images.
- Line 237-238: It seems that these sentence is more related to the lines 242-244. If so, please collate it later in the paragraph.
- Line 240: I don’t think “SEM observations […] [could allow] to identify […] haematite due to its colour”. Please rephrase.
- Figure 4: I do not understand where these SEM images come from. These PRM-19-10 and PRM-19-16 µ-samples are not described in the Material section. These images are not in the Supplementary Information folders that contain the images from the flakes µ-samples. Are these samples the ones mentioned on line 235 as coming from the decorated walls?
- Figure 4: on the contrary of Figure 3 and the SI folders of SEM images on flakes, shows indeed that the opal seems to have embedded the hematite. But it is important to note that this does not seem to be the case for the µ-samples from the flakes.
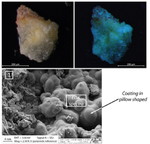
- Figure 4: It is important in my opinion to note that here one does not see the opal spheres, but only shapeless silica coating. Are the authors sure that this is also opal? No visible structure, no structural analysis (Raman, XRD or other): maybe it should remain “silica coating” for this part (in text, in the caption, and inside the figure)?
4.3 Opal identification by UV-fluorescence
- Figure 5: At this point it is quite surprising that µ-S-ECA-03 has a so different fluorescence spectrum. I checked on the SEM images and, as a matter of fact, this sample does not show a lot of opal 01. The image 14, for example, which seems to be the only opal spotted in this sample, is not seen in the larger image 01, so probably the opal is not very present in this sample. If you put before this section the section about observation of µ-samples under the binocular, it will be easier to explain it here.
- Line 268: in the figure 5 it is noted 543 and 569 nm. Please change the figure or the text so that it is the same values.
- Line 290-292: these sentences could be rephrased: one sentence to explain that even 1ppm of U can lead to green fluorescence, and, in the next sentence, the information about the potential content of hundreds of ppm in some deposit or in stalactites.
- Table 2: it could be interesting to explain what are the 604 nm and 650 nm bands from Fritsch et al. and Garcia-Guinea et al. since it seems to be quite different in wavelength, and not seen by all studies. Is this very light shoulders that you couldn’t see in your analysis? Is this specific to their own study? Is 604 and 650 the same thing?
- Line 303-304: Could you be more explicit on what you mean by “a range of spectra presenting uranyl spectral characteristics”? Do you mean there is a variability in the spectral characteristics in terms of intensity? Position? Or that there are spectra with and spectra without these spectral feature? Other?
- Line 311-313: could you explain how you decided to take 3 loadings and not 2 or 4? Is there an arbitrary threshold somewhere in the method? If so can you give the reader the value of this threshold? All this part should be in the Method section rather than in the Results section. There should be a sub-section of chemometrics/cartography in the Methods.
- Line 313-315: from what I understand, the loading 1 is, probably, the one with the highest load. The shape of the Initial loading 1 as seen in Figure 6 is quite strange since it is totally absent from Figure 5. Could you explain this?
- Lines 313-315: It would also be interesting that you clearly state that the initial loadings, calculated with the PURE algorithm, are calculated from the complete set of spectra recorded for the cartography. And, finally, for those non aware of chemometrics methods, that these loadings are calculated completely by the algorithm, with no prior human assumption, and that it is a posteriori that you interpret the loadings as being background, uranyl and matrix. And still, this “background” assumption should be explained.
- Figure 6: It would be interesting to write the values of the peaks (especially for the loading 2) so that it is easier to compare with Figure 5 and Table 2. In this caption you do not write which color is what, since you already have the legend in the figure. But in the caption of Figure 5 you did. Could you please decide between one way or the other and make it homogenous?
- Line 320-321: this sentence could be clearer, longer, or even 2 sentences, to explain better how the figure 7 is constructed especially for colleagues not very aware of chemometrics. Please explain that the MCR-ALS was applied to each spectra from the cartography, and allowed to give a proportion of each initial loading from the complete spectra of each pixel. And that this allow to produce the false color cartography of figure 7.
- Line 326: could you list references for this? I would guess that UV light, being quite high in energy, would go quite deep in the matter. And the visible light coming from the fluorescence, indeed, is probably coming only from the surface.
- Line 329: is the laser beam focused once for all the cartography, or is there an auto focus for each pixel? If the former, how did you choose the focus? In the middle of the sample?
- Line 333: The beginning of this sentence by “In addition” does not fit with the previous sentence that was more a limit of the method, while here you begin a sentence about a positive aspect of the method.
- Line 333-344: maybe the words semi-quantitative could be integrated somewhere in this paragraph? It seems that this would describe quite well the overall paragraph: this method is quantitative theoretically, with robust calibration, but on irregular rock samples, even with calibration, it would remain semi-quantitative.
4.4 Visual detection under UV light: laboratory experiments
I would have guessed lines 348-361 and Figure 8 would have bene placed in the manuscript before the more advanced techniques like spectral analysis, chemometrics, cartography. Just looking at the samples with a binocular under UV light should be placed before UV spectral measurements? Moreover, this section includes general bibliography on uranyl fluorescence and so on, so it should be placed before. Line 345-355 also should be before the 4.3 part. And Lines 358-359 clearly would benefit also to be integrated before: in this section you would write that µ-S-ECA-03 shows localized greenish fluorescence, and then, in the section with the current Fig. 5, you would explain that the fluorescence spectra of this sample does not show the uranyl signal, because of bad targeting or other. And lines 365-389 and figure 9, the comparison between visible and spectral, would remain here, after both methods are used and explained.
- Figure 8: here we see that the samples are sometimes composed of several grains of matter. It would be nice to be specific about it in the Material section. Maybe even give them names 05a and 05b for example?
- Figure 8: Could you please modify the figure so that it is “ECA” instead of “eca” for homogeneity with the text and other figures?
- Lines 365-372: This part is not very clear. First I was lost and finally I managed to get it. Figure 9B matches with Figure 7 but first Figure 7 was rotated and this is why I did not get it the first time. Please do write it in the text that part of Figure 9B corresponds to a rotation of Figure 7, and put a rectangle on figure 9B so that we can understand this more easily. This rectangle could be explained in the caption as being the equivalent surface as Figure 7.
- Lines 365-372: I think the protocol here should be placed in the Methods section and should be more precise since I don’t think any reader of the manuscript could redo your work on his own photos. I can see in the Matlab code the way you compare, but the way the RGB file is treated to extract the green part is not that clear to me. Moreover, please do not hesitate to refer to your Supplementary information files (especially here the matlab code) whenever it is necessary for the reader to understand that what you write is in the matlab file. (same as for SEM images, do not hesitate to call them when necessary in the text)
- Lines 380-381: In Figure 9, at the bottom right if you move the text in the caption as suggested below, would it be possible to have a graphic of the correlation between both methods as a function of the % of contribution in the total fluorescence signal?
- Figure 9: I think the caption of the figure should integrate the text in the bottom right corner of the figure.
4.5 Visual detection under UV light: field experiments
- Lines 402-405: If I read it well, there is no figure showing that. It would interesting to see the difference so that the green fluorescence response reported in lines 396-400 would be even more obvious, by comparison with the other part of the gallery. I confess I am not familiar with UV light images in caves, and that I am lightly color blind, and it seems that non color blind sees it easily, but a comparison with another part of the cave would be welcomed.
- Figure 10: in the current version of the manuscript, Figure 10 is very far from the 4.5 section. It would be better to put it closer, probably before the beginning of the discussion.
- Figure 10: The graphic about flaking rates and so on is quite complicated to understand, and is used only for one sentence (line 509-510). Maybe it is not necessary to have such a complicated Figure 10 and just keep the reference to Jaillet & Monney 2018 in the text. The left part of Figure 10 is really complicated to understand, for example what is “Surface of the cave (one wall : 242 m²)”? And the other square with, here, two walls? And why compare the surface of one wall with the surface of two walls? And how is it possible that the percentage of desquamation is more than 100 In some points? I think Figure 10 should remain simpler.
5. Discussion
- Lines 448-450: I guess there would be other works in rock art about UV light illumination of paintings. Probably at least works by Norbert Aujoulat, but certainly others. It would be good to integrate this literature here.
- Line 459: The last time and first time the acronym LIF was used before this point in the manuscript was many pages away. I think it would be good to write it completely here and put the acronym so that the end of the paper can make use of it.
- Lines 479-481: at this point of the manuscript I did not notice any evidence of this. Could you be more specific on the evidence that support such an hypothesis?
- Lines 489-496: I think this state of the art should be integrated since the introduction of the manuscript, instead of this section entitled “What do we know about Points Cave opal”.
- Line 515-518: In the current state of the manuscript this idea of relative chronology of deposits appears for the first time here, in the discussion. At least the observation of lines 516-517 should be made before in the SEM part of the results, as I proposed before.
- Lines 540-543: This paragraph or something similar would be interesting in the introduction, stating the hypothesis that this work could help validate. I proposed in the introduction comments to explain to the reader more about opal coatings before he leaves the introduction, and I can see here that these explanations are here, almost at the end of the manuscript.
- Lines 545-551: would it be possible to explain the two types of formation in the same order as presented in lines 541-542?
- Line 574: the beginning of this paragraph is abrupt. Would it be possible to make a connection with the previous one? Why do you continue with silica solutions?
- Lines 590-594: could be integrated in introduction too so that the reader knows why you study these coatings.
- Lines 603-605: same here, another interest in studying these coatings that could be clearly expressed in the introduction.
- Line 643: I propose to write “such as in coralloids”.
- Lines 650-651: I guess there are other authors to cite for the alteration of pigments on cave walls.
- Line 686: I don’t get the limitation by scale. Is the laser too small? Too big (I don’t think so)? If too small, it was complemented by your UV-light photos… I don’t see the point here of telling that the detection by laser beam is a limitation.
- Lines 696-699: If I’m right this is the first mention of this, and it appears in the conclusion. If it is important it should be discussed somewhere else, in the Discussion part probably. You mentioned the absence of opal coatings in pXRF and Raman studies (line 245), but not the fact that they had general troubles. You mention here the absence of “detection of iron spectroscopic signal”. Do you mean here by pXRF (which would be really surprising that opal coating could completely erase the signal from iron) or by Raman spectroscopy (in this case please do not write “iron spectroscopic signal” but iron oxide, or hematite, or whatever word that is compatible with Raman spectroscopy).
- Line 698: one more “thus”… there are too many (30!) “thus” in the manuscript. I think this is not as common in English as the French “ainsi”.
- Line 718: since opal-A identification is not sure at all, I think it is not the best place in the last sentence of the conclusion to mention it.
Bibliography:
Please provide the doi of the references, which are presently totally absent.
Please check on the bibliography, I noted a few problems:
Line 754 should be before Line 751 I think.
Line 798 should be before Line 795
Line 974 should be before line 971.
