
Evaluating Methods for Reducing Sampling Bias in Network Analysis
 based on reviews by Matthew Peeples and 1 anonymous reviewer
Social Network Analysis of Ancient Japanese Obsidian Artifacts Reflecting Sampling Bias Reduction
Abstract
Recommendation: posted 19 February 2024, validated 19 February 2024
Allison, J. (2024) Evaluating Methods for Reducing Sampling Bias in Network Analysis. Peer Community in Archaeology, 100335. https://doi.org/10.24072/pci.archaeo.100335
Recommendation
In a recent article, Fumihiro Sakahira and Hiro'omi Tsumura (2023) used social network analysis methods to analyze change in obsidian trade networks in Japan throughout the 13,000-year-long Jomon period. In the paper recommended here (Sakahira and Tsumura 2024), Social Network Analysis of Ancient Japanese Obsidian Artifacts Reflecting Sampling Bias Reduction they revisit that data and describe additional analyses that confirm the robustness of their social network analysis. The data, analysis methods, and substantive conclusions of the two papers overlap; what this new paper adds is a detailed examination of the data and methods, including use of bootstrap analysis to demonstrate the reasonableness of the methods they used to group sites into clusters.
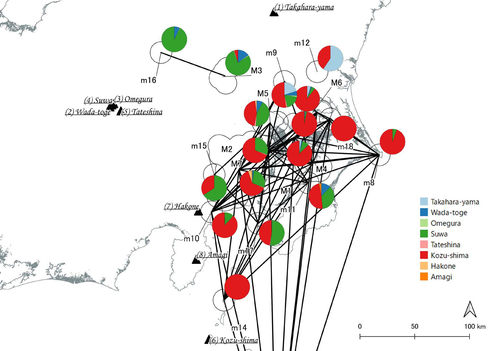
Both papers begin with a large dataset of approximately 21,000 artifacts from more than 250 sites dating to various times throughout the Jomon period. The number of sites and artifacts, varying sample sizes from the sites, as well as the length of the Jomon period, make interpretation of the data challenging. To help make the data easier to interpret and reduce problems with small sample sizes from some sites, the authors assign each site to one of five sub-periods, then define spatial clusters of sites within each period using the DBSCAN algorithm. Sites with at least three other sites within 10 km are joined into clusters, while sites that lack enough close neighbors are left as isolates. Clusters or isolated sites with sample sizes smaller than 30 were dropped, and the remaining sites and clusters became the nodes in the networks formed for each period, using cosine similarities of obsidian assemblages to define the strength of ties between clusters and sites.
The main substantive result of Sakahira and Tsumura’s analysis is the demonstration that, during the Middle Jomon period (5500-4500 cal BP), clusters and isolated sites were much more connected than before or after that period. This is largely due to extensive distribution of obsidian from the Kozu-shima source, located on a small island off the Japanese mainland. Before the Middle Jomon period, Kozu-shima obsidian was mostly found at sites near the coast, but during the Middle Jomon, a trade network developed that took Kozu-shima obsidian far inland. This ended after the Middle Jomon period, and obsidian networks were less densely connected in the late and last Jomon periods.
The methods and conclusions are all previously published (Sakahira and Tsumura 2023). What Sakahira and Tsumura add in Social Network Analysis of Ancient Japanese Obsidian Artifacts Reflecting Sampling Bias Reduction are:
· an examination of the distribution of cosine similarities between their clusters for each period
· a similar evaluation of the cosine similarities within each cluster (and among the unclustered sites) for each period
· bootstrap analyses of the mean cosine similarities and network densities for each time period
These additional analyses demonstrate that the methods used to cluster sites are reasonable, and that the use of spatially defined clusters as nodes (rather than the individual sites within the clusters) works well as a way of reducing bias from small, unrepresentative samples. An alternative way to reduce that bias would be to simply drop small assemblages, but that would mean ignoring data that could usefully contribute to the analysis.
The cosine similarities between clusters show patterns that make sense given the results of the network analysis. The Middle Jomon period has, on average, the highest cosine similarities between clusters, and most cluster pairs have high cosine similarities, consistent with the densely connected, spatially expansive network from that time period. A few cluster pairs in the Middle Jomon have low similarities, apparently representing comparisons including one of the few nodes on the margins on the network that had little or no obsidian from the Kozu-shima source. The other four time periods all show lower average inter-cluster similarities and many cluster pairs have either high or low similarities. This probably reflects the tendency for nearby clusters to have very similar obsidian assemblages to each other and for geographically distant clusters to have dissimilar obsidian assemblages. The pattern is consistent with the less densely connected networks and regionalization shown in the network graphs. Thinking about this pattern makes me want to see a plot of the geographic distances between the clusters against the cosine similarities. There must be a very strong correlation, but it would be interesting to know whether there are any cluster pairs with similarities that deviate markedly from what would be predicted by their geographic separation.
The similarities within clusters are also interesting. For each time period, almost every cluster has a higher average (mean and median) within-cluster similarity than the similarity for unclustered sites, with only two exceptions. This is partial validation of the method used for creating the spatial clusters; sites within the clusters are at least more similar to each other than unclustered sites are, suggesting that grouping them this way was reasonable.
Although Sakahira and Tsumura say little about it, most clusters show quite a wide range of similarities between the site pairs they contain; average within-cluster similarities are relatively high, but many pairs of sites in most clusters appear to have low similarities (the individual values are not reported, but the pattern is clear in boxplots for the first four periods). There may be value in further exploring the occurrence of low site-to-site similarities within clusters. How often are they caused by small sample sizes? Clusters are retained in the analysis if they have a total of at least 30 artifacts, but clusters may contain sites with even smaller sample sizes, and small samples likely account for many of the low similarity values between sites in the same cluster. But is distance between sites in a cluster also a factor? If the most distant sites within a spatially extensive cluster are dissimilar, subdividing the cluster would likely improve the results. Further exploration of these within-cluster site-to-site similarity values might be worth doing, perhaps by plotting the similarities against the size of the smallest sample included in the comparison, as well as by plotting the cosine similarity against the distance between sites. Any low similarity values not attributable to small sample sizes or geographic distance would surely be worth investigating further.
Sakahira and Tsumura also use a bootstrap analysis to simulate, for each time period, mean cosine similarities between clusters and between site pairs without clustering. They also simulate the network density for each time period before and after clustering. These analyses show that, almost always, mean simulated cosine similarities and mean simulated network density are higher after clustering than before. The simulated mean values also match the actual mean values better after clustering than before. This improved match to actual values when the sites are clustered for the bootstrap reinforces the argument that clustering the sites for the network analysis was a reasonable result.
The strength of this paper is that Sakahira and Tsumura return to reevaluate their previously published work, which demonstrated strong patterns through time in the nature and extent of Jomon obsidian trade networks. In the current paper they present further analyses demonstrating that several of their methodological decisions were reasonable and their results are robust. The specific clusters formed with the DBSCAN algorithm may or may not be optimal (which would be unreasonable to expect), but the authors present analyses showing that using spatial clusters does improve their network analysis. Clustering reduces problems with small sample sizes from individual sites and simplifies the network graphs by reducing the number of nodes, which makes the results easier to interpret.
Reference
Sakahira, F. and Tsumura, H. (2023). Tipping Points of Ancient Japanese Jomon Trade Networks from Social Network Analyses of Obsidian Artifacts. Frontiers in Physics 10:1015870. https://doi.org/10.3389/fphy.2022.1015870
Sakahira, F. and Tsumura, H. (2024). Social Network Analysis of Ancient Japanese Obsidian Artifacts Reflecting Sampling Bias Reduction, Zenodo, 10057602, ver. 7 peer-reviewed and recommended by Peer Community in Archaeology. https://doi.org/10.5281/zenodo.7969330

The recommender in charge of the evaluation of the article and the reviewers declared that they have no conflict of interest (as defined in the code of conduct of PCI) with the authors or with the content of the article. The authors declared that they comply with the PCI rule of having no financial conflicts of interest in relation to the content of the article.
This work was supported by JSPS KAKENHI (Grant nos. 21K21323, 22K18156, and 22H00021), Japan. The funding source was not involved in preparing the manuscript or in the collection, analysis, or interpretation of the data.
Reviewed by Matthew Peeples, 15 Dec 2023
I am writing this second reveiw based on the updated Version 6 of the manuscript, the included files, and the extensive response by the authors to the reviews of Version 5. Because the authors have written such a detailed response to the last round, my review here is quite short.
In the last round I had suggested that additional context needed to be provided here to help detail how and why the bootstrap approach was being used to assess results. The authors have done a good job of addressing this concern with new text describing both the details of the implementation and the interpretation of results (in particular the new sections between about lines 270 and 370). I had an easy time following the arguemnt in this current draft. I note that the author made several minor changes in equations/text and also made some larger changes to figures, all of which make the results clearer.
Finally, I had requested that the authors provide code and data with this article and they note that the data cannot be directly shared do to ongoing research. That is fair enough, but I am glad the authors provided sample data and extesnive comments in the code which will help anyone who wants to implement these methods in the future. I had an easier time working with this updated and documented code.
Overall, I think this revision strengthens the article substantially and this work provides an interesting approach to aggregating nodes for network analyses and other sorts of analyses that will be relevant to other settings as well.
Thanks,
Matt Peeples
https://doi.org/10.24072/pci.archaeo.100335.rev21Evaluation round #1
DOI or URL of the preprint: https://doi.org/10.5281/zenodo.7978389
Version of the preprint: 5
Author's Reply, 31 Oct 2023
Decision by James Allison, posted 02 Aug 2023, validated 02 Aug 2023
Two reviewers have completed reviews of the preprint "Social Network Analysis of Ancient Japanese Obsidian Artifacts Reflecting Sampling Bias Reduction." The reviewers comments are quite different from each other: one reviewer expresses concern about the similarity of the preprint with an article previously published in Frontiers in Physics, stating that the main original contribution is the very short section on the bootstrap simulation; the other review focuses on technical details and recommends adding more explanation, and particularly expanding the section on the bootstrap simulation.
In my opinion, the manuscript should be revised to address the issues raised by the reviewers. In particular, it should make clear how the current study relates to the previously published work, and focus more on the novel contributions of the current study. Adding details about exactly how the bootstrap procedure was implemented, providing a better explanation of what was gained by using the bootstrap, and providing more explanation about what the current study adds to already published work would make the manuscript much stronger.
Reviewed by Matthew Peeples, 30 Jun 2023
I am writing this review as an archaeologist with knowledge of network methods and bootstrap/simulation approaches but with little knowledge of the regional context. Thus my comments are largely focused on technical details of this work.
This article attemtps to define a sesnsible means for aggregating nodes using geography for the purposes of creating networks based on material assmeblages of varying size. This is similar to some past work focused on obsidian networks as the authors note but the assessment of aggregation is done much more formally than in past attempts. Further, this work also takes the next step to use simulation methods to evaluate the reasonableness of the clusters/aggregates that are formed in terms of network and component properties. Overall, I think this is a potentially useful approach that would be relevant in a range of settings where archaeological network methods have frequently been applied. I think the text is relatively easy to follow for the most part, with a couple of places where I think some additional technical detail is necessary to avoid confusion. In addition to this, I make a few additional suggestions below regarding wording and very nitty gritty details that could help avoid any confusion. Also, in the current draft I'm not sure if a convincing argument is made for why the bootstrap test helps to evaluate the clusters as defined specfiically, but I could be missing something where clarifications are suggested below.
Although I don't know the regional context, I was able to follow all of the descriptions of the sites, regions, and data. The discussion of previous work on the impact of sampling on network properties covers several of the relevant studies. I would suggest that work by Gjesfield (2015) is also particularly relevant to the current study and it might be useful to reference this:
Gjesfjeld, Erik 2015 Network Analysis of Archaeological Data from Hunter-Gatherers: Methodological Problems and Potential Solutions. Journal of Archaeological Method and Theory 22(1):182–205.
Another potentiall relevant study by Roberts et al. (full-disclosure, I'm also an author on this study but do think it's relevant here) is perhaps useful:
John M. Roberts, Yi Yin, Emily Dorshorst, Matthew A. Peeples, Barbara J. Mills. 2021. Assessing the performance of the bootstrap in simulated assemblage networks, Social Networks, 65:98-109.
The discussion of the specific methods used was, for the most part, fairly easy to follow with a couple of minor things I suggest addressing below and also one somewhat bigger issue. Specifically, the discussion of the bootstrap simulation is very minimal and it wasn't clear to me upon reading the text what had actually been done. I had to experiment with the code a fair bit to understand this analysis. What really needs to be outlined here is how were the data tables randomized for the replicates in the bootstrap (row-wise, column-wise, both). Since the term "bootstrap" is often used for a range of procedures (espeically by archaeologists), it would be useful to describe here what was done. For example, when I went to the code, I could see that sampling was done with replacement which is the typical definition of the nonparametric bootstrap, but there is enough variation in the archaeological literature on this that I think the details need to be made explicit in the text here. Further, in the "kara_df" object created in the simulation sample size by row was held constant which is an important point that needs to be discussed in more detail. I have further comments on the code below but I also think adding additional comments in the R code would help with these missing details as well.
In the results and discussion section, I was able to follow along but I was wondering if the use of some figures or alternative displays of data might be useful in helping readers evaluate results. The results for both the clustering are presented as means and arguments are made regarding weather the means are larger or smaller for various sub-groups. This made me think of what the underlying distributions might be for these data. A more informative approach might be to for example show a a boxplot/dotplot or similar visual of within cluster, between cluster, and no cluster values from which these means are derived. This would allow for the assessment and discussion of any outliers or other interesting properties of the distributions. As the number of points are fairly small a visual like a dotplot would probably work better than alternatives. As for figures 3 through 5, if color is possible, it would be useful here as well. Similarly, in the discussion of the bootstrap simulation, it would be useful to see distributions of values rather than just means and standard deviations. Overall, I had the most trouble understanding what had actually been done with the bootstrap test and how this relates to the "stability" of cluster solutions. This section/topic needs considerble more description for clarity. Specifically, if you resample data with replacement a bunch of times for a given cluster solution and get similar results, what does that tell you about the validity of that cluster solution and why? I think I'm missing something here.
R Code and Reproducibility
R code was provided but the data used in this article were not provided so I wasn't able to directly replicate the results. I was generally able to follow the code with some effort but comments added to the code would help considerably. I would recommend that the authors provide the data used in the final version. If there is some reason that this cannot be done, that reason should be explained in the text and sample data of a simlar format should be provided instead so that the code is at least testable. With so few comments, it took me a fair bit of effort to get the code to run with simulated data. In order to do this, I created a data frame with site samples in the 8 categories based on two different multinomial distributions to simulate regional variation. Once I figured out how the vectors and data frame needed to be formatted, I was able to run the code which produces bootstrap replicates as "kara_df" for each "n" run and then outputs the mean only of the upper triangle of each similarity matrix. I could be wrong here, but since this only outputs the mean and not the full distribution the line "sd(simil_vec)" then is the standard deviation of the means across the sampling distribution or the standard error of the mean rather than the SD of values. I could be missing something here but that detail and wording should be checked. Overall, the code appears to work (at least with my simulated data) and produces results as described but I still had trouble fully understanding how this relates to the stability of cluster solutions since you weren't, for example, testing different cluster solutions. I think if details of the bootstrap and it's puprose are described in greater detail in the text that would be helpful.
Minor things:
A few minor things I noticed...
Line 168 - "minPts is the optimal size of the minimum cluster". Isn't it just the minimum size? I wasn't sure what optimal meant here.
Line 198 - The equation text here is a bit confusing as it isn't the standard vector notation most are probably used to. Since cosine similarity is the dot product of two vectors divided by their norms, I would suggest denoting vectors and magnitudes in typical vector notation. For example, in LaTex it would be: S{c}(a,b) = \frac{a \cdot b}{||a|| \space ||b||}
where the dot product of vectors a and be are the numerator and the denominator is the product (not dot product as indicated here) of the magnitudes of a and b.
Line 208, Could you provide a little text on why a particular threshold was selected for links?
https://doi.org/10.24072/pci.archaeo.100335.rev11


