
ALLISON James
- Anthropology Department, Brigham Young University, Provo, United States of America
- Archaeometry, Ceramics, Computational archaeology, Dating, Landscape archaeology, North America, Spatial analysis, Theoretical archaeology
- recommender
Recommendations: 3
Reviews: 0
Recommendations: 3
Social Network Analysis of Ancient Japanese Obsidian Artifacts Reflecting Sampling Bias Reduction
Evaluating Methods for Reducing Sampling Bias in Network Analysis
Recommended by James Allison based on reviews by Matthew Peeples and 1 anonymous reviewerIn a recent article, Fumihiro Sakahira and Hiro'omi Tsumura (2023) used social network analysis methods to analyze change in obsidian trade networks in Japan throughout the 13,000-year-long Jomon period. In the paper recommended here (Sakahira and Tsumura 2024), Social Network Analysis of Ancient Japanese Obsidian Artifacts Reflecting Sampling Bias Reduction they revisit that data and describe additional analyses that confirm the robustness of their social network analysis. The data, analysis methods, and substantive conclusions of the two papers overlap; what this new paper adds is a detailed examination of the data and methods, including use of bootstrap analysis to demonstrate the reasonableness of the methods they used to group sites into clusters.
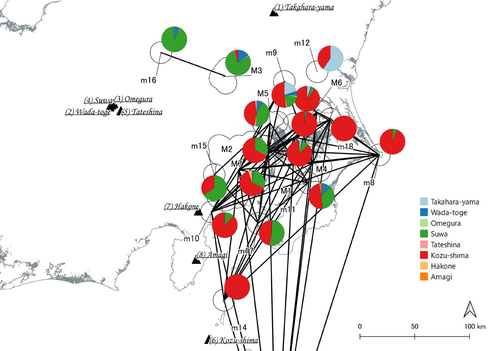
Both papers begin with a large dataset of approximately 21,000 artifacts from more than 250 sites dating to various times throughout the Jomon period. The number of sites and artifacts, varying sample sizes from the sites, as well as the length of the Jomon period, make interpretation of the data challenging. To help make the data easier to interpret and reduce problems with small sample sizes from some sites, the authors assign each site to one of five sub-periods, then define spatial clusters of sites within each period using the DBSCAN algorithm. Sites with at least three other sites within 10 km are joined into clusters, while sites that lack enough close neighbors are left as isolates. Clusters or isolated sites with sample sizes smaller than 30 were dropped, and the remaining sites and clusters became the nodes in the networks formed for each period, using cosine similarities of obsidian assemblages to define the strength of ties between clusters and sites.
The main substantive result of Sakahira and Tsumura’s analysis is the demonstration that, during the Middle Jomon period (5500-4500 cal BP), clusters and isolated sites were much more connected than before or after that period. This is largely due to extensive distribution of obsidian from the Kozu-shima source, located on a small island off the Japanese mainland. Before the Middle Jomon period, Kozu-shima obsidian was mostly found at sites near the coast, but during the Middle Jomon, a trade network developed that took Kozu-shima obsidian far inland. This ended after the Middle Jomon period, and obsidian networks were less densely connected in the late and last Jomon periods.
The methods and conclusions are all previously published (Sakahira and Tsumura 2023). What Sakahira and Tsumura add in Social Network Analysis of Ancient Japanese Obsidian Artifacts Reflecting Sampling Bias Reduction are:
· an examination of the distribution of cosine similarities between their clusters for each period
· a similar evaluation of the cosine similarities within each cluster (and among the unclustered sites) for each period
· bootstrap analyses of the mean cosine similarities and network densities for each time period
These additional analyses demonstrate that the methods used to cluster sites are reasonable, and that the use of spatially defined clusters as nodes (rather than the individual sites within the clusters) works well as a way of reducing bias from small, unrepresentative samples. An alternative way to reduce that bias would be to simply drop small assemblages, but that would mean ignoring data that could usefully contribute to the analysis.
The cosine similarities between clusters show patterns that make sense given the results of the network analysis. The Middle Jomon period has, on average, the highest cosine similarities between clusters, and most cluster pairs have high cosine similarities, consistent with the densely connected, spatially expansive network from that time period. A few cluster pairs in the Middle Jomon have low similarities, apparently representing comparisons including one of the few nodes on the margins on the network that had little or no obsidian from the Kozu-shima source. The other four time periods all show lower average inter-cluster similarities and many cluster pairs have either high or low similarities. This probably reflects the tendency for nearby clusters to have very similar obsidian assemblages to each other and for geographically distant clusters to have dissimilar obsidian assemblages. The pattern is consistent with the less densely connected networks and regionalization shown in the network graphs. Thinking about this pattern makes me want to see a plot of the geographic distances between the clusters against the cosine similarities. There must be a very strong correlation, but it would be interesting to know whether there are any cluster pairs with similarities that deviate markedly from what would be predicted by their geographic separation.
The similarities within clusters are also interesting. For each time period, almost every cluster has a higher average (mean and median) within-cluster similarity than the similarity for unclustered sites, with only two exceptions. This is partial validation of the method used for creating the spatial clusters; sites within the clusters are at least more similar to each other than unclustered sites are, suggesting that grouping them this way was reasonable.
Although Sakahira and Tsumura say little about it, most clusters show quite a wide range of similarities between the site pairs they contain; average within-cluster similarities are relatively high, but many pairs of sites in most clusters appear to have low similarities (the individual values are not reported, but the pattern is clear in boxplots for the first four periods). There may be value in further exploring the occurrence of low site-to-site similarities within clusters. How often are they caused by small sample sizes? Clusters are retained in the analysis if they have a total of at least 30 artifacts, but clusters may contain sites with even smaller sample sizes, and small samples likely account for many of the low similarity values between sites in the same cluster. But is distance between sites in a cluster also a factor? If the most distant sites within a spatially extensive cluster are dissimilar, subdividing the cluster would likely improve the results. Further exploration of these within-cluster site-to-site similarity values might be worth doing, perhaps by plotting the similarities against the size of the smallest sample included in the comparison, as well as by plotting the cosine similarity against the distance between sites. Any low similarity values not attributable to small sample sizes or geographic distance would surely be worth investigating further.
Sakahira and Tsumura also use a bootstrap analysis to simulate, for each time period, mean cosine similarities between clusters and between site pairs without clustering. They also simulate the network density for each time period before and after clustering. These analyses show that, almost always, mean simulated cosine similarities and mean simulated network density are higher after clustering than before. The simulated mean values also match the actual mean values better after clustering than before. This improved match to actual values when the sites are clustered for the bootstrap reinforces the argument that clustering the sites for the network analysis was a reasonable result.
The strength of this paper is that Sakahira and Tsumura return to reevaluate their previously published work, which demonstrated strong patterns through time in the nature and extent of Jomon obsidian trade networks. In the current paper they present further analyses demonstrating that several of their methodological decisions were reasonable and their results are robust. The specific clusters formed with the DBSCAN algorithm may or may not be optimal (which would be unreasonable to expect), but the authors present analyses showing that using spatial clusters does improve their network analysis. Clustering reduces problems with small sample sizes from individual sites and simplifies the network graphs by reducing the number of nodes, which makes the results easier to interpret.
Reference
Sakahira, F. and Tsumura, H. (2023). Tipping Points of Ancient Japanese Jomon Trade Networks from Social Network Analyses of Obsidian Artifacts. Frontiers in Physics 10:1015870. https://doi.org/10.3389/fphy.2022.1015870
Sakahira, F. and Tsumura, H. (2024). Social Network Analysis of Ancient Japanese Obsidian Artifacts Reflecting Sampling Bias Reduction, Zenodo, 10057602, ver. 7 peer-reviewed and recommended by Peer Community in Archaeology. https://doi.org/10.5281/zenodo.7969330
3Duewelsteene - A website for the 3D visualization of the megalithic passage grave Düwelsteene near Heiden in Westphalia, Germany
Online presentation of the digital reconstruction process of a megalithic tomb : “3Duewelsteene”
Recommended by Sophie C. Schmidt and James Allison based on reviews by Robert Bischoff, Ronald Visser and Scott Ure“3Duewelsteene - A website for the 3D visualization of the megalithic passage grave Düwelsteene near Heiden in Westphalia, Germany” (Tharandt 2024) presents several 3-dimensional models of the Düwelsteene monument, along with contextual information about the grave and the process of creating the models. The website (https://3duewelsteene.github.io/) includes English and German versions, making it accessible to a wide audience. The website itself serves as the primary means of presenting the data, rather than as a supplement to a written text. This is an innovative and engaging way to present the research to a wider public.
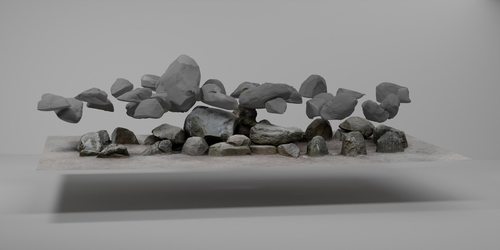
Düwelsteene (“Devil’s Stones”) is a megalithic passage grave from the Funnel Beaker culture, dating to approximately 3300 BC. to 2600 BC. that was excavated in 1932. The website displays three separate 3-dimensional models. They ares shown in the 3D viewer software 3DHOP, which enables viewers to interact with the models in several ways, Annotations on the models display further information.
The first model was created by image-based modeling and shows the monument as it appears today.
A second model uses historical photographs and excavation data to reconstruct the grave as it appeared prior to the 1932 archaeological excavation. Restoration work following the excavation relocated many of the stones. Pre-1932 photographs collected from residents of the nearby town of Heiden were then used to create a model showing what the tomb looked like before the restoration work. It is commendable that a “certainty view” of the model shows the certainty with which the stones can be put at the reconstructed place. Gaps in the 3D models of stones that were caused by overlap with other stones have been filled with a rough mesh and marked as such, thereby differentiating between known and unknown parts of the stones.
The third model is the most imaginative and most interesting. As it shows as the grave as it might have appeared in approximately 3000 B.C., many aspects of this model are necessarily somewhat speculative. There is no direct evidence for exact size and shape of the capstones, the height of the mound, and other details. But enough is known about other similar constructions to allow these details to be inferred with some confidence. Again, care was taken to enable viewers to distinguish between the stones that are still in existence and those that were reconstructed.
A video on the home page of the website adds a nice touch. It starts with the model of the Düwelsteene as it currently appears then shows, in reverse order, the changes to the grave, ending with the inferred original state.
The 3D reconstructions are convincing and the methods well described. This project follows an open science approach and the FAIR principles, which is commendable and cutting edge in the field of Digital Archaeology. The preprint of the website hosted on zenodo includes all the photos, text, html files, and nine individual 3D model (.ply) files that are combined in the reconstructions exhibited on the website. A “readme.md” file includes details about building the models using CloudCompare and Blender, and modifications to the 3D viewer software (3DHOP) to get the website to improve the display of the reconstructions. We have to note that the link between the reconstructed models and the html page does not work when the files are downloaded from zenodo and opened offline. The html pages open in the browser, and the individual ply files work fine, but the 3D models do not display on the browser page when the html files are opened offline. The online version of the website is working perfectly.
The 3Düwelsteene website combines the presentation of archaeological domain knowledge to a lay audience as well as in-depths information on the reconstruction process to make it an interesting contribution for researchers. By providing data and code for the website it also models an Open Science approach, which enables other researchers to re-use these materials. We congratulate the author on a successful reconstruction of the megalithic tomb, an admirable presentation of the archaeological work and the thoughtful outreach to a broad audience.
Bibliography
Tharandt, L., 3Duewelsteene - A website for the 3D visualization of the megalithic passage grave Düwelsteene near Heiden in Westphalia, Germany, https://3duewelsteene.github.io/, Zenodo, 7948379, ver. 4 peer-reviewed and recommended by Peer Community in Archaeology. https://doi.org/10.5281/zenodo.7948379
Percolation Package - From script sharing to package publication
Sharing Research Code in Archaeology
Recommended by James Allison based on reviews by Thomas Rose, Joe Roe and 1 anonymous reviewerThe paper “Percolation Package – From Script Sharing to Package Publication” by Sophie C. Schmidt and Simon Maddison (2023) describes the development of an R package designed to apply Percolation Analysis to archaeological spatial data. In an earlier publication, Maddison and Schmidt (2020) describe Percolation Analysis and provide case studies that demonstrate its usefulness at different spatial scales. In the current paper, the authors use their experience collaborating to develop the R package as part of a broader argument for the importance of code sharing to the research process.
The paper begins by describing the development process of the R package, beginning with borrowing code from a geographer, refining it to fit archaeological case studies, and then collaborating to further refine and systematize the code into an R package that is more easily reusable by other researchers. As the review by Joe Roe noted, a strength of the paper is “presenting the development process as it actually happens rather than in an idealized form.” The authors also include a section about the lessons learned from their experience.
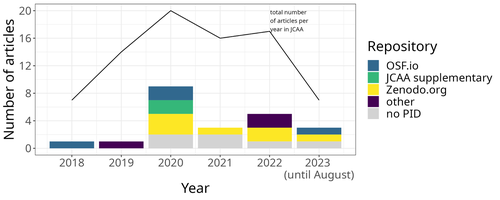
Moving on from the anecdotal data of their own experience, the authors also explore code sharing practices in archaeology by briefly examining two datasets. One dataset comes from “open-archaeo” (https://open-archaeo.info/), an on-line list of open-source archaeological software maintained by Zack Batist. The other dataset includes articles published between 2018 and 2023 in the Journal of Computer Applications in Archaeology. Schmidt and Maddison find that these two datasets provide contrasting views of code sharing in archaeology: many of the resources in the open-archaeo list are housed on Github, lack persistent object identifiers, and many are not easily findable (other than through the open-archaeo list). Research software attached to the published articles, on the other hand, is more easily findable either as a supplement to the published article, or in a repository with a DOI.
The examination of code sharing in archaeology through these two datasets is preliminary and incomplete, but it does show that further research into archaeologists’ code-writing and code-sharing practices could be useful. Archaeologists often create software tools to facilitate their research, but how often? How often is research software shared with published articles? How much attention is given to documentation or making the software usable for other researchers? What are best (or good) practices for sharing code to make it findable and usable? Schmidt and Maddison’s paper provides partial answers to these questions, but a more thorough study of code sharing in archaeology would be useful. Differences among journals in how often they publish articles with shared code, or the effects of age, gender, nationality, or context of employment on attitudes toward code sharing seem like obvious factors for a future study to consider.
Shared code that is easy to find and easy to use benefits the researchers who adopt code written by others, but code authors also have much to gain by sharing. Properly shared code becomes a citable research product, and the act of code sharing can lead to productive research collaborations, as Schmidt and Maddison describe from their own experience. The strength of this paper is the attention it brings to current code-sharing practices in archaeology. I hope the paper will also help improve code sharing in archaeology by inspiring more archaeologists to share their research code so other researchers can find and use (and cite) it.
References
Maddison, M.S. and Schmidt, S.C. (2020). Percolation Analysis – Archaeological Applications at Widely Different Spatial Scales. Journal of Computer Applications in Archaeology, 3(1), p.269–287. https://doi.org/10.5334/jcaa.54
Schmidt, S. C., and Maddison, M. S. (2023). Percolation Package - From script sharing to package publication, Zenodo, 7966497, ver. 3 peer-reviewed and recommended by Peer Community in Archaeology. https://doi.org/10.5281/zenodo.7966497