
PEEPLES Matthew
- School of Human Evolution and Social Change, Arizona State University, Tempe, United States of America
- Archaeometry, Ceramics, Computational archaeology, North America, Spatial analysis
Recommendations: 0
Reviews: 4
Reviews: 4
Similarity Network Fusion: Understanding Patterns and their Spatial Significance in Archaeological Datasets
A different approach to similarity networks in Archaeology - Similarity Network Fusion
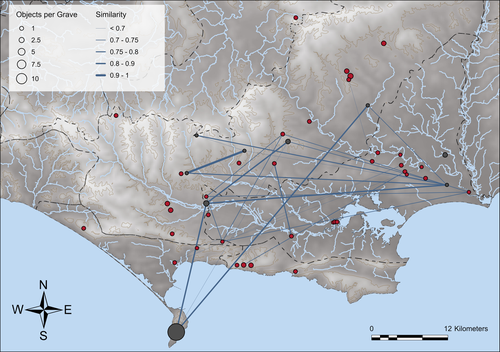
Recommended by Joel Santos based on reviews by Matthew Peeples and 1 anonymous reviewerThis is a fascinating paper for anyone interested in network analysis or the chronology and cultures of the case study, namely the Late prehistoric burial sites in Dorset, for which the author’s approach allowed a new perspective over an already deeply studied area [1]. This paper's implementation of Similarity Network Fusion (SNF) is noteworthy. This method is typically utilized within genetic research but has yet to be employed in Archaeology. SNF has the potential to benefit Archaeology due to its unique capabilities and approach significantly.
The author exhibits a deep and thorough understanding of previous investigations concerning material and similarity networks while emphasizing the innovative nature of this particular study. The SNF approach intends to improve a lack of the most used (in Archaeology) similarity coefficient, the Brainerd-Robinson, in certain situations, mainly in heterogenous and noisy datasets containing a small number of samples but a large number of measurements, scale differences, and collection biases, among other things. The SNF technique, demonstrated in the case study, effectively incorporates various similarity networks derived from different datatypes into one network.
As shown during the Dorset case study, the SNF application has a great application in archaeology, even in already available data, allowing us to go further and bring new visions to the existing interpretations. As stated by the author, SNF shows its potential for other applications and fields in archaeology coping with similar datasets, such as archaeobotany or archaeozoology, and seems to complement different multivariate statistical approaches, such as correspondence or cluster analysis.
This paper has been subject to two excellent revisions, which the author mostly accepted. One of the revisions was more technical, improving the article in the metadata part, data availability and clarification, etc. Although the second revision was more conceptual and gave some excellent technical inputs, it focused more on complementary aspects that will allow the paper to reach a wider audience. I vividly recommend its publication.
References
[1] Geitlinger, T. (2024). Similarity Network Fusion: Understanding Patterns and their Spatial Significance in Archaeological Datasets. Zenodo, 7998239, ver. 3 peer-reviewed and recommended by Peer Community in Archaeology. https://doi.org/10.5281/zenodo.7998239
Social Network Analysis of Ancient Japanese Obsidian Artifacts Reflecting Sampling Bias Reduction
Evaluating Methods for Reducing Sampling Bias in Network Analysis
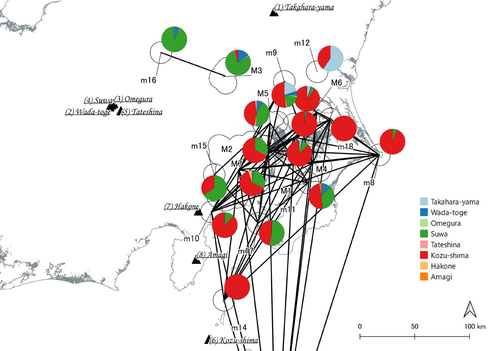
Recommended by James Allison based on reviews by Matthew Peeples and 1 anonymous reviewerIn a recent article, Fumihiro Sakahira and Hiro'omi Tsumura (2023) used social network analysis methods to analyze change in obsidian trade networks in Japan throughout the 13,000-year-long Jomon period. In the paper recommended here (Sakahira and Tsumura 2024), Social Network Analysis of Ancient Japanese Obsidian Artifacts Reflecting Sampling Bias Reduction they revisit that data and describe additional analyses that confirm the robustness of their social network analysis. The data, analysis methods, and substantive conclusions of the two papers overlap; what this new paper adds is a detailed examination of the data and methods, including use of bootstrap analysis to demonstrate the reasonableness of the methods they used to group sites into clusters.
Both papers begin with a large dataset of approximately 21,000 artifacts from more than 250 sites dating to various times throughout the Jomon period. The number of sites and artifacts, varying sample sizes from the sites, as well as the length of the Jomon period, make interpretation of the data challenging. To help make the data easier to interpret and reduce problems with small sample sizes from some sites, the authors assign each site to one of five sub-periods, then define spatial clusters of sites within each period using the DBSCAN algorithm. Sites with at least three other sites within 10 km are joined into clusters, while sites that lack enough close neighbors are left as isolates. Clusters or isolated sites with sample sizes smaller than 30 were dropped, and the remaining sites and clusters became the nodes in the networks formed for each period, using cosine similarities of obsidian assemblages to define the strength of ties between clusters and sites.
The main substantive result of Sakahira and Tsumura’s analysis is the demonstration that, during the Middle Jomon period (5500-4500 cal BP), clusters and isolated sites were much more connected than before or after that period. This is largely due to extensive distribution of obsidian from the Kozu-shima source, located on a small island off the Japanese mainland. Before the Middle Jomon period, Kozu-shima obsidian was mostly found at sites near the coast, but during the Middle Jomon, a trade network developed that took Kozu-shima obsidian far inland. This ended after the Middle Jomon period, and obsidian networks were less densely connected in the late and last Jomon periods.
The methods and conclusions are all previously published (Sakahira and Tsumura 2023). What Sakahira and Tsumura add in Social Network Analysis of Ancient Japanese Obsidian Artifacts Reflecting Sampling Bias Reduction are:
· an examination of the distribution of cosine similarities between their clusters for each period
· a similar evaluation of the cosine similarities within each cluster (and among the unclustered sites) for each period
· bootstrap analyses of the mean cosine similarities and network densities for each time period
These additional analyses demonstrate that the methods used to cluster sites are reasonable, and that the use of spatially defined clusters as nodes (rather than the individual sites within the clusters) works well as a way of reducing bias from small, unrepresentative samples. An alternative way to reduce that bias would be to simply drop small assemblages, but that would mean ignoring data that could usefully contribute to the analysis.
The cosine similarities between clusters show patterns that make sense given the results of the network analysis. The Middle Jomon period has, on average, the highest cosine similarities between clusters, and most cluster pairs have high cosine similarities, consistent with the densely connected, spatially expansive network from that time period. A few cluster pairs in the Middle Jomon have low similarities, apparently representing comparisons including one of the few nodes on the margins on the network that had little or no obsidian from the Kozu-shima source. The other four time periods all show lower average inter-cluster similarities and many cluster pairs have either high or low similarities. This probably reflects the tendency for nearby clusters to have very similar obsidian assemblages to each other and for geographically distant clusters to have dissimilar obsidian assemblages. The pattern is consistent with the less densely connected networks and regionalization shown in the network graphs. Thinking about this pattern makes me want to see a plot of the geographic distances between the clusters against the cosine similarities. There must be a very strong correlation, but it would be interesting to know whether there are any cluster pairs with similarities that deviate markedly from what would be predicted by their geographic separation.
The similarities within clusters are also interesting. For each time period, almost every cluster has a higher average (mean and median) within-cluster similarity than the similarity for unclustered sites, with only two exceptions. This is partial validation of the method used for creating the spatial clusters; sites within the clusters are at least more similar to each other than unclustered sites are, suggesting that grouping them this way was reasonable.
Although Sakahira and Tsumura say little about it, most clusters show quite a wide range of similarities between the site pairs they contain; average within-cluster similarities are relatively high, but many pairs of sites in most clusters appear to have low similarities (the individual values are not reported, but the pattern is clear in boxplots for the first four periods). There may be value in further exploring the occurrence of low site-to-site similarities within clusters. How often are they caused by small sample sizes? Clusters are retained in the analysis if they have a total of at least 30 artifacts, but clusters may contain sites with even smaller sample sizes, and small samples likely account for many of the low similarity values between sites in the same cluster. But is distance between sites in a cluster also a factor? If the most distant sites within a spatially extensive cluster are dissimilar, subdividing the cluster would likely improve the results. Further exploration of these within-cluster site-to-site similarity values might be worth doing, perhaps by plotting the similarities against the size of the smallest sample included in the comparison, as well as by plotting the cosine similarity against the distance between sites. Any low similarity values not attributable to small sample sizes or geographic distance would surely be worth investigating further.
Sakahira and Tsumura also use a bootstrap analysis to simulate, for each time period, mean cosine similarities between clusters and between site pairs without clustering. They also simulate the network density for each time period before and after clustering. These analyses show that, almost always, mean simulated cosine similarities and mean simulated network density are higher after clustering than before. The simulated mean values also match the actual mean values better after clustering than before. This improved match to actual values when the sites are clustered for the bootstrap reinforces the argument that clustering the sites for the network analysis was a reasonable result.
The strength of this paper is that Sakahira and Tsumura return to reevaluate their previously published work, which demonstrated strong patterns through time in the nature and extent of Jomon obsidian trade networks. In the current paper they present further analyses demonstrating that several of their methodological decisions were reasonable and their results are robust. The specific clusters formed with the DBSCAN algorithm may or may not be optimal (which would be unreasonable to expect), but the authors present analyses showing that using spatial clusters does improve their network analysis. Clustering reduces problems with small sample sizes from individual sites and simplifies the network graphs by reducing the number of nodes, which makes the results easier to interpret.
Reference
Sakahira, F. and Tsumura, H. (2023). Tipping Points of Ancient Japanese Jomon Trade Networks from Social Network Analyses of Obsidian Artifacts. Frontiers in Physics 10:1015870. https://doi.org/10.3389/fphy.2022.1015870
Sakahira, F. and Tsumura, H. (2024). Social Network Analysis of Ancient Japanese Obsidian Artifacts Reflecting Sampling Bias Reduction, Zenodo, 10057602, ver. 7 peer-reviewed and recommended by Peer Community in Archaeology. https://doi.org/10.5281/zenodo.7969330
Social Network Analysis, Community Detection Algorithms, and Neighbourhood Identification in Pompeii
A Valuable Contribution to Archaeological Network Research: A Case Study of Pompeii
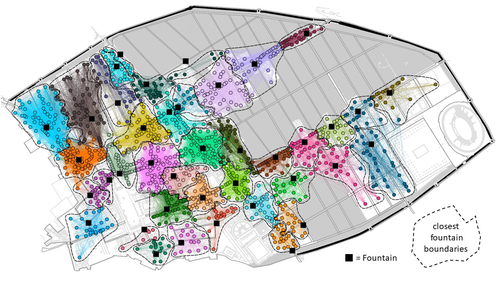
Recommended by David Laguna-Palma based on reviews by Matthew Peeples, Isaac Ullah and Philip VerhagenThe paper entitled 'Social Network Analysis, Community Detection Algorithms, and Neighbourhood Identification in Pompeii' [1] presents a significant contribution to the field of archaeological network research, particularly in the challenging task of identifying urban neighborhoods within the context of Pompeii. This study focuses on the relational dynamics within urban neighborhoods and examines their indistinct boundaries through advanced analytical methods. The methodology employed provides a comprehensive analysis of community detection, including the Louvain and Leiden algorithms, and introduces a novel Convex Hull of Admissible Modularity Partitions (CHAMP) algorithm. The incorporation of a network approach into this domain is both innovative and timely.
The potential impact of this research is substantial, offering new perspectives and analytical tools. This opens new avenues for understanding social structures in ancient urban settings, which can be applied to other archaeological contexts beyond Pompeii. Moreover, the manuscript is not only methodologically solid but also well-written and structured, making complex concepts accessible to a broad audience.
In conclusion, this study represents a valuable contribution to the field of archaeology, particularly for archaeological network research. Their results not only enhance our knowledge of Pompeii but also provide a robust framework for future studies in similar historical contexts. Therefore, this publication advances our understanding of social dynamics in historical urban environments. The rigorous analysis, combined with the innovative application of network algorithms, makes this study a noteworthy addition to the existing body of network science literature. It is recommended for a wide range of scholars interested in the intersection of archaeology, history, and network science.
Reference
[1] Notarian, Matthew. 2024. Social Network Analysis, Community Detection Algorithms, and Neighbourhood Identification in Pompeii. https://doi.org/10.5281/zenodo.8305968
The strength of parthood ties. Modelling spatial units and fragmented objects with the TSAR method – Topological Study of Archaeological Refitting
A practical computational approach to stratigraphic analysis using conjoinable material culture.
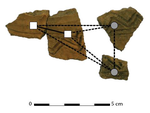
Recommended by Hector A. Orengo based on reviews by Robert Bischoff, Matthew Peeples and 1 anonymous reviewerThe paper by Plutniak [1] presents a new method that uses refitting to help interpret stratigraphy using the topological distribution of conjoinable material culture. This new method opens up new avenues to the archaeological use of network analysis but also to assess the integrity of interpreted excavation layers. Beyond its evident applicability to standard excavation practice, the paper presents a series of characteristics that exemplify archaeological publication best practices and, as someone more versed in computational than in refitting studies I would like to comment upon.
It was no easy task to find adequate reviewers for this paper as it combines techniques and expertise that are not commonly found together in individual researchers. However, Plutniak, with help from three reviewers, particularly M. Peeples, a leading figure in archaeological applications of network science, makes a considerable effort to be accessible to non-specialist archaeologists. The core Topological Study of Archaeological Refitting (TSAR) method is freely accessible as the R package archeofrag, which is available at the Comprehensive R Archive Network (https://CRAN.R-project.org/package=archeofrag) that can be applied without the need to understand all its mathematical, graph theory and coding aspects. Beside these, an online interface including test data has been provided (https://analytics.huma-num.fr/Sebastien.Plutniak/archeofrag/), which aims to ease access to the method to those archaeologists inexperienced with R. Finally, supplementary material showing how to use the package and evaluating its potential through excellent examples is provided as both pdf and Rmw (Sweave) files. This is an important companion for the paper as it allows a better understanding of the methods presented in the paper and its practical application.
The author shows particular care in testing the potential and capabilities of the method. For example, a function is provided “frag.observer.failure” to test the robustness of the edge count method against the TSAR method, which is able to prove that TSAR can deal well with incomplete information. As a further step in this direction both simulated and real field-acquired data are used to test the method which further proves that archeofrag is not only able to quantitatively assess the mixture of excavated layers but to propose meaningful alternatives, which no doubt will add an increased methodological consistency and thoroughness to previous quantitative approaches to material refitting work, even when dealing with very complex stratigraphies.
All in all, this paper makes an important contribution to core archaeological practice through the use of innovative, reproducible and accessible computational methods. I fully endorse it for the conscious and solid methods it presents but also for its adherence to open publication practices. I hope that it can become of standard use in the reconstruction of excavated stratigraphical layers through conjoinable material culture.
[1] Plutniak, S. 2021. The Strength of Parthood Ties. Modelling Spatial Units and Fragmented Objects with the TSAR Method – Topological Study of Archaeological Refitting. OSF Preprints, q2e69, ver. 3 Peer-reviewed and recommended by PCI Archaeology. https://doi.org/10.31219/osf.io/q2e69.