
An important comparison of software for Scale Sensitive Fractal Analysis : are ancient and new results compatible?
Surface texture analysis in Toothfrax and MountainsMap® SSFA module: Different software packages, different results?
Abstract
Recommendation: posted 24 November 2022, validated 01 December 2022
Queffelec, A. and Rivals, F. (2022) An important comparison of software for Scale Sensitive Fractal Analysis : are ancient and new results compatible?. Peer Community in Archaeology, 100024. https://doi.org/10.24072/pci.archaeo.100024
Recommendation
The community of archaeologists, bioanthropologist and paleontologists relying on tools use-wear and dental microwear has grown in the recent years, mainly driven by the spread of confocal microscopes in the laboratories. If the diversity of microscopes is quite high, the main software used for 3D surface texture data analysis are mostly different versions of the same Mountains Map core. In addition to this software, since the beginning of 3D surface texture analysis in dental microwear, surface sensitive fractal analysis (SSFA) initially developed for industrial research (Brown & Savary, 1991) have been performed in our disciplines with the Sfrax/Toothfrax software for two decades (Ungar et al., 2003). This software being discontinued, these calculations have been integrated to the new versions of Mountains Map, with multi-core computing, full integration in the software and an update of the calculation itself.
New research based on these standard parameters of surface texture analysis will be, from now on, mainly calculated with this new add-on of Mountains Map, and will be directly compared with the important literature based on the previous software. The question addressed by Calandra et al. (2022), gathering several prominent researchers in this domain including the Mountains Map developer F. Blateyron, is key for the future research: can we directly compare SSFA results from both software?
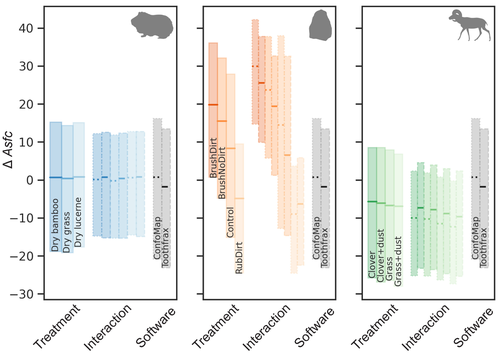
Thanks to a Bayesian approach to this question, and comparing results calculated with both software on three different datasets (two on dental microwear, one on lithic raw materials), the authors show that the two software gives statistically different results for all surface texture parameters tested in the paper. Nevertheless, applying the new calculation to the datasets, they also show that the results published in original studies with these datasets would have been similar. Authors also claim that in the future, researchers will need to re-calculate the fractal parameters of previously published 3D surfaces and cannot simply integrate ancient and new data together.
We also want to emphasize the openness of the work published here. All datasets have been published online and will be probably very useful for future methodological works. Authors also published their code for statistical comparison of datasets, and proposed a fully reproducible article that allowed the reviewers to check the content of the paper, which can also make this article of high interest for student training.
This article is therefore a very important methodological work for the community, as noted by all three reviewers. It will certainly support the current transition between the two software packages and it is necessary that all surface texture specialists take these results and the recommendation of authors into account: calculate again data from ancient measurements, and share the 3D surface measurements on open access repositories to secure their access in the future.
References
Brown CA, and Savary G (1991) Describing ground surface texture using contact profilometry and fractal analysis. Wear, 141, 211–226. https://doi.org/10.1016/0043-1648(91)90269-Z
Calandra I, Bob K, Merceron G, Blateyron F, Hildebrandt A, Schulz-Kornas E, Souron A, and Winkler DE (2022) Surface texture analysis in Toothfrax and MountainsMap® SSFA module: Different software packages, different results? Zenodo, 7219877, ver. 4 peer-reviewed and recommended by Peer Community in Archaeology. https://doi.org/10.5281/zenodo.7219877
Ungar PS, Brown CA, Bergstrom TS, and Walker A (2003) Quantification of dental microwear by tandem scanning confocal microscopy and scale-sensitive fractal analyses. Scanning: The Journal of Scanning Microscopies, 25, 185–193. https://doi.org/10.1002/sca.4950250405

The recommender in charge of the evaluation of the article and the reviewers declared that they have no conflict of interest (as defined in the code of conduct of PCI) with the authors or with the content of the article. The authors declared that they comply with the PCI rule of having no financial conflicts of interest in relation to the content of the article.
Reviewed by Antony Borel , 16 Nov 2022
The authors have addressed each of my comments with care and answered to all of them. They modified the manuscript accordingly and I have no more questions for them. I would like to thank them for their work and I think the paper is ready for recommendation/publication.
https://doi.org/10.24072/pci.archaeo.100024.rev21Reviewed by anonymous reviewer 2, 15 Nov 2022
I have read all the replies made by the authors to my comments, and have also checked that they are reflected in the mansucript. The authors have corrected everything to my personal satisfaction and I think the manuscript is suitable to be sent for publication.
https://doi.org/10.24072/pci.archaeo.100024.rev22Evaluation round #1
DOI or URL of the preprint: https://doi.org/10.5281/zenodo.6669276
Author's Reply, 11 Nov 2022
Decision by Alain Queffelec and Florent Rivals, posted 02 Sep 2022
Dear Authors,
We have received feedback from three reviewers who have reviewed your work in depth. They all agree that your work is important to the field and requires only minor changes before it can be recommended. They also all recognize the very open manner in which you provided the data and code, as well as the quality of your supplementary materials.
We would therefore be very pleased to receive the responses you can provide to all the comments from the three reviewers, and we will be most willing to arrange a quick round of peer-review of this new version, as some of the reviewers' comments are very technical and would require them to check your responses themselves.
Sincerely,
Alain Queffelec and Florent Rivals
Reviewed by Antony Borel, 06 Aug 2022
Review of
“Dental microwear texture analysis in Toothfrax and MountainsMap® SSFA module: Different software packages, different results?”
by Ivan CALANDRA, Konstantin BOB, Gildas MERCERON, François BLATEYRON, Andreas HILDEBRANDT, Ellen SCHULZ-KORNAS, Antoine SOURON, Daniela E. WINKLER
Reviewed by anonymous reviewer 1, 25 Aug 2022
Calandra and colleagues’ manuscript on “Dental microwear texture analysis in Toothfrax and MountainsMap® SSFA module: Different software packages, different results?” provides a compelling analysis of two widely used software packages for the analysis of surface micro-topography. They use three published datasets that represent a wide range of variation in surface topographies which is appropriate. They conclude that the results of each package—while similar in their discriminatory power—are not directly comparable, and since the Toothfrax software is no longer supported, reanalysis of previously published data using MountainsMap is largely inevitable. These results are unlikely to surprise researchers familiar with these software packages, but it is nonetheless important/essential that it is demonstrated.
The authors also call for more transparency in data sharing/availability—something that is not widely practiced among researchers conducting DMTA analysis at present. Overall, I find the manuscript convincing, well-argued, and the exhaustive supplemental material/raw data will ensure replicability of analyses (or enable others to retort/enhance any findings described).
My critiques are minor, and many can be accepted/rejected at the discretion of the authors. However, I do think it is important to address the utility of comparing the general results from previous Toothfrax/Sfrax analyses with newer MountainsMap results despite the inability to directly compare them in a statistically meaningful way. The authors never state that they are not comparable in the general/descriptive manner that I am referring to, but it may be useful to reinforce this point.
INTRODUCTION
The introduction is clear and concisely addresses the motivations of the study, frames the motivations within the scope of relevant research, and transparently outlines the questions of concern. I only acknowledge two (minor) points. Whether the authors find it necessary to address these minor issues are optional as they are detail-oriented and do not change the scope of the manuscript in any way.
Lines 68-69: It would be useful to revise the description of what DMTA is quantifying since surface microasperities are also influenced by tooth-to-tooth contact and corrosion in addition to food and abrasive particles. I have listed several references below that examine these forms of wear using DMTA. It is not necessary for the authors to cite all these papers, but I did want to provide some support for my suggestion.
- Hara, A.T., S.V. Livengood, F. Lippert, G.J. Eckert, and P.S. Ungar. 2016. "Dental surface texture characterization based on erosive tooth wear processes." Journal of Dental Research 95 (5):537-542. doi: 10.1177/0022034516629941.
- Hara, A. T., D. Elkington-Stauss, P. S. Ungar, F. Lippert, G. J. Eckert, and D. T. Zero. 2021. "Three-Dimensional Surface Texture Characterization of In Situ Simulated Erosive Tooth Wear." Journal of Dental Research 100 (11):1236-1242. doi: 10.1177/00220345211005678.
- Krueger, K. L., E. Chwa, A. S. Peterson, J. C. Willman, A. Fok, B. van Heel, Y. Heo, M. Weston, and R. DeLong. 2021. "Technical note: Artificial Resynthesis Technology for the experimental formation of dental microwear textures." American Journal of Physical Anthropology 176 (4):703-712. doi: https://doi.org/10.1002/ajpa.24395.
- Ranjitkar, S, A Turan, C Mann, GA Gully, M Marsman, S Edwards, JA Kaidonis, C Hall, D Lekkas, and P Wetselaar. 2017. "Surface-sensitive microwear texture analysis of attrition and erosion." Journal of Dental Research 96 (3):300-307. doi: https://doi.org/10.1177%2F0022034516680585.
Lines 84-87: While I agree that many researchers have been using only complexity and anisotropy for dietary reconstruction on postcanine teeth, I would like to note that numerous studies examining DMTA in anterior teeth have highlighted Tfv as a particularly useful variable to discriminate between various behavioral regimes. Since the lack of Tfv is still a limitation in the Mountains Map software, the authors may not find this to be a useful critique. However, it does point out that there are essential modifications that still need to occur with Mountains Map before it can totally replace the Toothfrax/Sfrax for certain research purposes. I address this in the CONCLUSIONS as well. Again, below is a representative sample of some of the work I am referring to, but the authors do not need to cite each paper if they choose to address this point.
- Krueger, K. L., and P. S. Ungar. 2009. "Incisor microwear textures of five bioarcheological groups." International Journal of Osteoarchaeology 20 (5):549-560. doi: http://dx.doi.org/10.1002/oa.1093.
- Krueger, K. L. 2015. "Reconstructing diet and behavior in bioarchaeological groups using incisor microwear texture analysis." Journal of Archaeological Science: Reports 1:29-37. doi: http://dx.doi.org/10.1016/j.jasrep.2014.10.002.
- Krueger, K. L., P. S. Ungar, D. Guatelli-Steinberg, J.-J. Hublin, A. Pérez-Pérez, E. Trinkaus, and J. C. Willman. 2017. "Anterior dental microwear textures show habitat-driven variability in Neandertal behavior." Journal of Human Evolution 105:13-23. doi: http://dx.doi.org/10.1016/j.jhevol.2017.01.004.
- Krueger, K. L., J. C. Willman, G. J. Matthews, J.-J. Hublin, and A. Pérez-Pérez. 2019. "Anterior tooth-use behaviors among early modern humans and Neandertals." PLOS ONE 14 (11):e0224573. doi: https://doi.org/10.1371/journal.pone.0224573.
MATERIALS AND METHODS
I believe there is sufficient detail in the materials and methods to allow replication of the results by other researchers. Importantly, not only was the raw data from the published data sets available, but all the processing results are available as MNT and PDF files. I was able to assess the PDF files and they are standardized and appear complete. Thus, should researchers not agree with how any aspect of this study was conducted, they should be able to evaluate the data themselves (as well as scripts).
The research compendium on GitHub is active and references the additional materials in Zenodo.
I have a rudimentary knowledge of Bayesian statistical approaches to these forms of data. Nevertheless, the authors explain the analyses thoroughly, include detailed schematics of the models in supplementary materials, and include an additional summary exposing differences between the results in the current manuscript and all three original studies from which the comparative data are derived. I found this latter supplement to be a welcome addition as it also points out the importance of including raw data in publications since different analytical choices produce different results.
RESULTS
I am not capable of evaluating the scripts and re-running the statistical analyses.
The links to all supplemental plots and data presentation was extremely useful. The figures and tables in the manuscript proper—as well as the supplemental plots and results—are appropriate. The results are clearly laid out and described.
Line 524 (typo): I think an “a” should be inserted before “results”.
DISCUSSION
The discussion and conclusion are supported by the results and adequate interpretations of the discrepancies between the software packages are proposed. As with the introduction, the discussion and conclusions have reasonable coverage of the relevant literature and history of micro-topographic analyses in relevant disciplines.
Section 4.4. Implications: I completely agree—and believe the authors convincingly demonstrate—that the data outputs of each software package are not statistically comparable and should not be mixed. However, I think it would be useful to highlight how many of the general results and their interpretations from Toothfrax and MountainsMap are comparable in a general sense. I think the appropriate analogy is how researchers frame discussions of results from dental microwear analyses using SEM or optical microscopy with the results obtained from DMTA.
I bring this up because of the recommendation to re-analyze raw surface data with MountainsMap. While I agree that re-analysis is essential for future research, the process will likely be slow and the results will resemble a patchwork of the total data that was originally published using Toothfrax/Sfrax for quite some time. Likewise, the absence of Tfv in MountainsMap would require further re-analysis once it is available (or at least waiting for it to become available) for researchers that rely on this variable (see comments above). This critique does not detract from the main conclusions of the manuscript, but it would perhaps be a useful caveat to mention.
TABLES AND FIGURES
The figures and tables are largely understandable without reference to the main body of the article. The minor exception is the use of abbreviations in some cases. While the abbreviations are given in the main text (e.g., SSFA, NMP, and HDI), it may be useful to include the full phrase along with the abbreviation in the legends.
SUPPLEMENTARY MATERIAL
One small issue with reference to Pedergnana et al discussion (Page 2), there is a typo. Please change “tough” to “though”.
https://doi.org/10.24072/pci.archaeo.100272.rev12
Reviewed by anonymous reviewer 2, 01 Sep 2022
The study by Calandra and colleagues presents a very interesting assessment of the analysis of microwear data obtained using two different software packages. The authors point out some rather worrying issues when using the different software to compute certain parameters, which in turn would indicate that future research should go into homogenizing the computation and calculation of these parameters. The work is additionally supported by a very well thought out set of Bayesian statistical analyses, complemented with well structured code that has been made readily available by the authors (I am very pleased to see this).
As my area of expertise is not in microwear, I cannot make too many comments on the introduction or discussion part of this manuscript. Nevertheless, I have got some minor comments on certain more technical aspects of the statistics that hope will help the authors.
Line 218 - 226: In most other publications by the authors they cite an ISO norm or paper indicating why they have used the steps referred to in their templace for the processing of 3D surfaces. Would this not be required here as well?
Line 388 - 389: How were priors defined so that they "cover the whole range of data"? How specifically did the authors define their prior probability parameters and how were these parameters ensured to fulfill this "cover the whole range of data" criteria? In line 399 the authors state "The visual inspection helps in assessing whether the prior indeed covers the whole data range", however is there not a more automated/quantifiable way to perform this without having to rely on a "visual inspection"?
Lines 420-424: I think the arviz Python library should also be included in this list of used packages.
In the discussion I have some more specific commentaries. Firstly I would suggest formulae be numbered and cited in the text. Next, I have some concerns with some of the descriptions of these formulae, that should be clarified. It is not clear in lines 570 to 572 that the authors are referring to the Mean Absolute Deviation, therefore I suggest they simply correct the sentence using: "HAsfc is calculated using the Mean Absolute Deviation, instead of the median". Next I am interested to know whether MAD has been normalised or not, and if not, why that is? (although I understand if/that this has probably got nothing to do with the authors - if it doesn't, do the authors know whether MAD has been normalised?). A simple reflection on these formulae - theoretically the formula presented in line 568 should be a more reliable measure of this type of data, considering how point clouds (i.e. the type of data produced by the confocal), are prone to certain statistical errors which would make the median absolute deviation more reliable (Höhle and Höhle, 2009, DOI: 10.1016/j.isprsjprs.2009.02.003). I would therefore think the MountainsMap output to be a better approximation to the real surface characteristics.
In line 651 the authors talk about the calculation of the "mean of all vectors", yet the formula in line 652 does not represent the mean at all - this formula actually describes the sum of all vectors excluding the final value (N - 1). Additionally, I would move the definition of N from line 656 up to line 653, considering how N is used earlier than it is defined. If the authors truly want to convey the mean of all vectors, the formula should be written as (I apologise for writing LaTeX annotation here but do not know of another way of conveying what the formula should be written as);
S_{relL} = \frac{1}{N} \sum_{i = 0}^{N} relL_{i}
Some final reflections: An interesting point that the authors raise in the discussion are the differences between MountainsMap and Toothfrax due to updates in the programming... as I am sure the authors agree, this is a fundamental component of computational science; software must be maintained regularly and updated as required so as to ensure the most accurate and computationally efficient results. Here lies one of my problems with these type of software, however, that they are not open source nor easy to obtain. Finally the authors discuss that raw surfaces must be made available - I completely agree with this, however I unfortunately think this is going to be a hard obstacle to overcome, especially when working with data obtained using confocal microscopy, as most surface scans occupy a lot of memory and require pretty powerful computers in order to process such data... nevertheless, I hope in the future we can find a way to make this sharing of data more feasible.
https://doi.org/10.24072/pci.archaeo.100272.rev13


