
Latest recommendations

| Id | Title▼ | Authors | Abstract | Picture | Thematic fields | Recommender | Reviewers | Submission date | |
|---|---|---|---|---|---|---|---|---|---|
01 Dec 2022
Surface texture analysis in Toothfrax and MountainsMap® SSFA module: Different software packages, different results?An important comparison of software for Scale Sensitive Fractal Analysis : are ancient and new results compatible?Recommended by Alain Queffelec and Florent Rivals based on reviews by Antony Borel and 2 anonymous reviewers and Florent Rivals based on reviews by Antony Borel and 2 anonymous reviewers
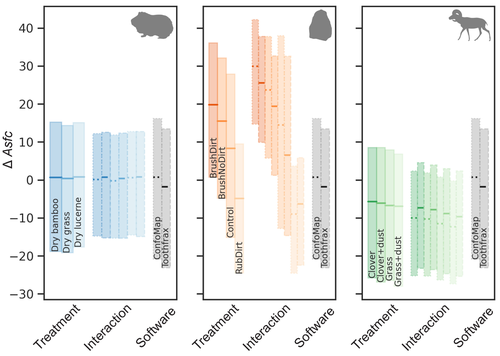
The community of archaeologists, bioanthropologist and paleontologists relying on tools use-wear and dental microwear has grown in the recent years, mainly driven by the spread of confocal microscopes in the laboratories. If the diversity of microscopes is quite high, the main software used for 3D surface texture data analysis are mostly different versions of the same Mountains Map core. In addition to this software, since the beginning of 3D surface texture analysis in dental microwear, surface sensitive fractal analysis (SSFA) initially developed for industrial research (Brown & Savary, 1991) have been performed in our disciplines with the Sfrax/Toothfrax software for two decades (Ungar et al., 2003). This software being discontinued, these calculations have been integrated to the new versions of Mountains Map, with multi-core computing, full integration in the software and an update of the calculation itself. New research based on these standard parameters of surface texture analysis will be, from now on, mainly calculated with this new add-on of Mountains Map, and will be directly compared with the important literature based on the previous software. The question addressed by Calandra et al. (2022), gathering several prominent researchers in this domain including the Mountains Map developer F. Blateyron, is key for the future research: can we directly compare SSFA results from both software? Thanks to a Bayesian approach to this question, and comparing results calculated with both software on three different datasets (two on dental microwear, one on lithic raw materials), the authors show that the two software gives statistically different results for all surface texture parameters tested in the paper. Nevertheless, applying the new calculation to the datasets, they also show that the results published in original studies with these datasets would have been similar. Authors also claim that in the future, researchers will need to re-calculate the fractal parameters of previously published 3D surfaces and cannot simply integrate ancient and new data together. We also want to emphasize the openness of the work published here. All datasets have been published online and will be probably very useful for future methodological works. Authors also published their code for statistical comparison of datasets, and proposed a fully reproducible article that allowed the reviewers to check the content of the paper, which can also make this article of high interest for student training. This article is therefore a very important methodological work for the community, as noted by all three reviewers. It will certainly support the current transition between the two software packages and it is necessary that all surface texture specialists take these results and the recommendation of authors into account: calculate again data from ancient measurements, and share the 3D surface measurements on open access repositories to secure their access in the future. References Brown CA, and Savary G (1991) Describing ground surface texture using contact profilometry and fractal analysis. Wear, 141, 211–226. https://doi.org/10.1016/0043-1648(91)90269-Z Calandra I, Bob K, Merceron G, Blateyron F, Hildebrandt A, Schulz-Kornas E, Souron A, and Winkler DE (2022) Surface texture analysis in Toothfrax and MountainsMap® SSFA module: Different software packages, different results? Zenodo, 7219877, ver. 4 peer-reviewed and recommended by Peer Community in Archaeology. https://doi.org/10.5281/zenodo.7219877 Ungar PS, Brown CA, Bergstrom TS, and Walker A (2003) Quantification of dental microwear by tandem scanning confocal microscopy and scale-sensitive fractal analyses. Scanning: The Journal of Scanning Microscopies, 25, 185–193. https://doi.org/10.1002/sca.4950250405 | Surface texture analysis in Toothfrax and MountainsMap® SSFA module: Different software packages, different results? | Ivan CALANDRA, Konstantin BOB, Gildas MERCERON, François BLATEYRON, Andreas HILDEBRANDT, Ellen SCHULZ-KORNAS, Antoine SOURON, Daniela E. WINKLER | <p>The scale-sensitive fractal analysis (SSFA) of dental microwear textures is traditionally performed using the software Toothfrax. SSFA has been recently integrated to the software MountainsMap® as an optional module. Meanwhile, Toothfrax suppor... | | Computational archaeology, Palaeontology, Traceology | Alain Queffelec | Anonymous, John Charles Willman, Antony Borel | 2022-07-07 09:58:50 | |
Today
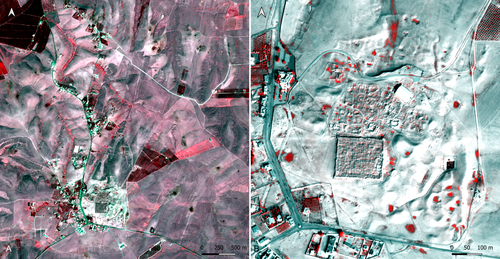
Study and enhancement of the heritage value of a fortified settlement along the Limes Arabicus. Umm ar-Rasas (Amman, Jordan) between remote sensing analysis, photogrammetry and laser scanner surveys.Integrating remote sensing and photogrammetric approaches to studying a fortified settlement along the Limes Arabicus: Umm ar‐Rasas (Amman, Jordan).Recommended by Alessia Brucato based on reviews by Francesc C. Conesa, Giuseppe Ceraudo and 1 anonymous reviewerDi Palma et alii manuscript delves into applying remote sensing and photogrammetry methods to document and analyze the castrum at the Umm er-Rasas site in Jordan. This research aimed to map all the known archaeological evidence, detect new historical structures, and create a digital archive of the site's features for study and education purposes [1]. Their research has been organized into two phases. The first one consisted of a remote sensing survey and involved collecting historical and modern aerial and satellite imagery, such as: aerial photographs by Sir Marc Aurel Stein from 1939; panchromatic spy satellite images from the Cold War period (Corona KH-4B and Hexagon KH-9); high and very high resolution (HR and VHR) modern multispectral satellite images (Pléiades-1A and Pléiades Neo-4) [1]. This dataset was processed using the ENVI 4.4 software and applying multiple image-enhancing techniques (Pansharpening, RGB composite, data fusion, and Principal Component Analysis). Then, the resulting images were integrated into a QGIS project, allowing for visual analyses of the site's features and terrain. These investigations provided: · a broad overview of the site, · the discovery of a previously unknown archaeological feature (the northeastern dam), · a stage for targeted ground-level investigations [1]. The project's second phase was dedicated to intensive fieldwork operations, including pedestrian surveys, stratigraphic excavations, and photogrammetric recordings, such as: photographic reconstructions via Structure from Motion (SfM) and laser scanner sessions (using two FARO X330 HDR). In particular, the laser scanner data were processed with Reconstructor 4.4, which provided highly detailed 3D models for the QGIS database. These results were crucial in validating the information acquired during the first phase. Overall, the paper is well written, with clear objectives and a systematic presentation of the site [2,3,10,11], the research materials, and the study phases. The dataset was described in meticulous detail (especially the remote sensing sources and the laser scanner recordings). The methods implemented in this study are rigorously described [4,5,6,7,8,9] and show a high level of integration between aerial and field techniques. The results are neatly illustrated and fit into the current debates about the efficacy of remote sensing detection and multiscale approaches in archaeological research. In conclusion, this manuscript significantly contributes to archaeological research, unveiling new and exciting findings about the site of Umm er-Rasas. Its findings and methodologies warrant publication and further exploration. References: 1. Di Palma, F., Gabrielli, R., Merola, P., Miccoli, I. and Scardozzi, G. (2024). Study and enhancement of the heritage value of a fortified settlement along the Limes Arabicus. Umm ar-Rasas (Amman, Jordan) between remote sensing analysis, photogrammetry and laser scanner surveys. Zenodo, 8306381, ver. 3 peer-reviewed and recommended by Peer Community in Archaeology. https://doi.org/10.5281/zenodo.8306381 2. Abela J. and Acconci A. (1997), Umm al‐Rasas Kastron Mefa’a. Excavation Campaign 1997. Church of St. Paul: northern and southern flanks. Liber Annus, 47, 484‐488. 3. Bujard J. (2008), Kastron Mefaa, un bourg à l'époque byzantine: Travaux de la Mission archéologique de la Fondation Max van Berchem à Umm al‐Rasas, Jordanie (1988‐1997), PhD diss., University of Fribourg 2008. 4. Cozzolino M., Gabrielli R., Galatà P., Gentile V., Greco G., Scopinaro E. (2019), Combined use of 3D metric surveys and non‐invasive geophysical surveys at the stylite tower (Umm ar‐Rasas, Jordan), Annals of geophysics, 62, 3, 1‐9. http://dx.doi.org/10.4401/ag‐8060 5. Gabrielli R., Salvatori A., Lazzari A., Portarena D. (2016), Il sito di Umm ar‐Rasas – Kastron Mefaa – Giordania. Scavare documentare conservare, viaggio nella ricerca archeologica del CNR. Roma 2016, 236‐240. 6. Gabrielli R., Portarena D., Franceschinis M. (2017), Tecniche di documentazione dei tappeti musivi del sito archeologico di Umm al‐Rasas Kastron Mefaa (Giordania). Archeologia e calcolatori, 28 (1), 201‐218. https://doi.org/10.19282/AC.28.1.2017.12 7. Lasaponara R., Masini N. (2012 ed.), Satellite Remote Sensing: A New Tool for Archaeology, New York 2012. 8. Lasaponara R., Masini N. and Scardozzi G. (2007), Immagini satellitari ad alta risoluzione e ricerca archeologica: applicazioni e casi di studio con riprese pancromatiche e multispettrali di QuickBird. Archeologia e Calcolatori, 18 (2), 187‐227. https://core.ac.uk/download/pdf/33150351.pdf 9. Lasaponara R., Masini N., Scardozzi G. (2010), Elaborazioni di immagini satellitari ad alta risoluzione e ricognizione archeologica per la conoscenza degli insediamenti rurali del territorio di Hierapolis di Frigia (Turchia). Il dialogo dei Saperi – Metodologie integrate per i Beni Culturali, Edizioni scientifiche italiane, 479‐494. 10. Piccirillo M., Abela J. and Pappalardo C. (2007), Umm al‐Rasas ‐ campagna 2007. Rapporto di scavo. Liber Annus, 57, 660‐668. 11. Poidebard A. (1934), La trace de Rome dans le désert de Syrie : le limes de Trajan à la conquête arabe ; recherches aériennes 1925 – 1932. Paris : Geuthner. | Study and enhancement of the heritage value of a fortified settlement along the Limes Arabicus. Umm ar-Rasas (Amman, Jordan) between remote sensing analysis, photogrammetry and laser scanner surveys. | Di Palma Francesca, Gabrielli Roberto, Merola Pasquale, Miccoli Ilaria, Scardozzi Giuseppe | <p>The Limes Arabicus is an excellent laboratory for experimenting with the huge potential of historical remote sensing data for identifying and mapping fortified centres along this sector of the eastern frontier of the Roman Empire and then the B... | | Antiquity, Asia, Classic, Landscape archaeology, Mediterranean, Remote sensing, Spatial analysis | Alessia Brucato | 2023-08-31 23:34:16 | ||
14 Nov 2023
Student Feedback on Archaeogaming: Perspectives from a Classics ClassroomLearning with Archaeogaming? A study based on student feedbackRecommended by Sebastian Hageneuer based on reviews by Jeremiah McCall and 1 anonymous reviewer
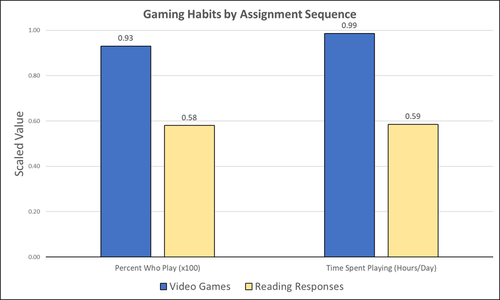
This paper (Stephan 2023) is about the use of video games as a pedagogical tool in class. Instead of taking the perspective of a lecturer, the author seeks the student’s perspectives to evaluate the success of an interactive teaching method at the crossroads of history, archaeology, and classics. The paper starts with a literature review, that highlights the intensive use of video games among college students and high schoolers as well as the impact video games can have on learning about the past. The case study this paper is based on is made with the game Assassin’s Creed: Odyssey, which is introduced in the next part of the paper as well as previous works on the same game. The author then explains his method, which entailed the tasks students had to complete for a class in classics. They could either choose to play a video game or more classically read some texts. After the tasks were done, students filled out a 14-question-survey to collect data about prior gaming experience, assignment enjoyment, and other questions specific to the assignments. The results were based on only a fraction of the course participants (n=266) that completed the survey (n=26), which is a low number for doing statistical analysis. Besides some quantitative questions, students had also the possibility to freely give feedback on the assignments. Both survey types (quantitative answers and qualitative feedback) solely relied on the self-assessment of the students and one might wonder how representative a self-assessment is for evaluating learning outcomes. Both problems (size of the survey and actual achievements of learning outcomes) are getting discussed at the end of the paper, that rightly refers to its results as preliminary. I nevertheless think that this survey can help to better understand the role that video games can play in class. As the author rightly claims, this survey needs to be enhanced with a higher number of participants and a better way of determining the learning outcomes objectively. This paper can serve as a start into how we can determine the senseful use of video games in classrooms and what students think about doing so. References
Stephan, R. (2023). Student Feedback on Archaeogaming: Perspectives from a Classics Classroom, Zenodo, 8221286, ver. 6 peer-reviewed and recommended by Peer Community in Archaeology. https://doi.org/10.5281/zenodo.8221286
| Student Feedback on Archaeogaming: Perspectives from a Classics Classroom | Stephan, Robert | <p>This study assesses student feedback from the implementation of Assassin’s Creed: Odyssey as a teaching tool in a lower level, general education Classics course (CLAS 160B1 - Meet the Ancients: Gateway to Greece and Rome). In this course, which... | | Antiquity, Classic, Mediterranean | Sebastian Hageneuer | Anonymous, Jeremiah McCall | 2023-08-07 16:45:31 | |
08 Apr 2024
Spaces of funeral meaning. Modelling socio-spatial relations in burial contextsA new approach to a data ontology for the qualitative assessment of funerary spacesRecommended by Asuman Lätzer-Lasar based on reviews by 2 anonymous reviewers
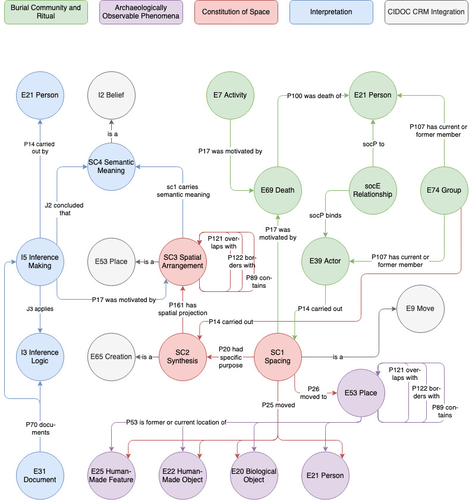
The paper by Aline Deicke [1] is very readable, and it succeeds in presenting a still unnoticed topic in a well-structured way. It addresses the topic of “how to model social-spatial relations in antiquity”, as the title concisely implies, and makes important and interesting points about their interrelationship by drawing on latest theories of sociologists such as Martina Löw combined with digital tools, such as the CIDOC CRM-modeling. The author provides an introductory insight into the research history of funerary archaeology and addresses the problematic issue of not having investigated fully the placement of entities of the grave inventory. So far, the focus of the analysis has been on the composition of the assemblage and not on the positioning within this space-and time-limited context. However, the positioning of the various entities within the burial context also reveals information about the objects themselves, their value and function, as well as about the world view and intentions of the living and dead people involved in the burial. To obtain this form of qualitative data, the author suggests modeling knowledge networks using the CIDOC CRM. The method allows to integrate the spatial turn combined with aspects of the actor-network-theory. The theoretical backbone of the contribution is the fundamental scholarship of Martina Löw’s “Raumsoziologie” (sociology of space), especially two categories of action namely placing and spacing (SC1). The distinction between the two types of action enables an interpretative process that aims for the detection of meaningfulness behind the creation process (deposition process) and the establishment of spatial arrangement (find context). To illustrate with a case study, the author discusses elite burial sites from the Late Urnfield Period covering a region north of the Alps that stretches from the East of France to the entrance of the Carpathian Basin. With the integration of very basic spatial relations, such as “next to”, “above”, “under” and qualitative differentiations, for instance between iron and bronze knives, the author detects specific patterns of relations: bronze knives for food preparing (ritual activities at the burial site), iron knives associated with the body (personal accoutrement). The complexity of the knowledge engineering requires the gathering of several CIDOC CRM extensions, such as CRMgeo, CRMarchaeo, CRMba, CRMinf and finally CRMsoc, the author rightfully suggests. In the end, the author outlines a path that can be used to create this kind of data model as the basis for a graph database, which then enables a further analysis of relationships between the entities in a next step. Since this is only a preliminary outlook, no corrections or alterations are needed. The article is an important step in advancing digital archaeology for qualitative research. References [1] Deicke, A. (2024). Spaces of funeral meaning. Modelling socio-spatial relations in burial contexts. Zenodo, 8310170, ver. 4 peer-reviewed and recommended by Peer Community in Archaeology. https://doi.org/10.5281/zenodo.8310170 | Spaces of funeral meaning. Modelling socio-spatial relations in burial contexts | Aline Deicke | <p>Burials have long been one of the most important sources of archaeology, especially when studying past social practices and structure. Unlike archaeological finds from settlements, objects from graves can be assumed to have been placed there fo... | | Computational archaeology, Protohistory, Spatial analysis, Theoretical archaeology | Asuman Lätzer-Lasar | 2023-09-01 23:15:41 | ||
25 Jul 2023
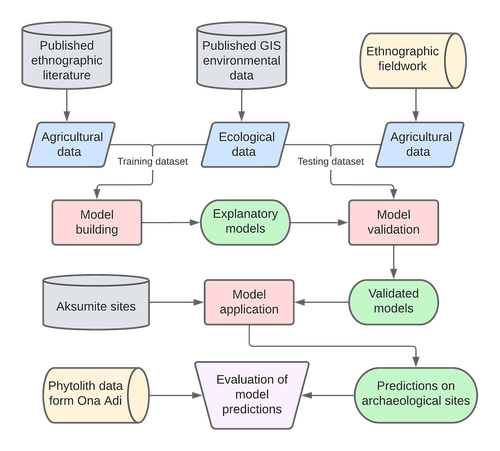
Sorghum and finger millet cultivation during the Aksumite period: insights from ethnoarchaeological modelling and microbotanical analysisAn innovative integration of ethnoarchaeological models with phytolith data to study histories of C4 crop cultivationRecommended by Emma Loftus based on reviews by Tanya Hattingh and 1 anonymous reviewerThis article “Sorghum and finger millet cultivation during the Aksumite period: insights from ethnoarchaeological modelling and microbotanical analysis”, submitted by Ruiz-Giralt and colleagues (2023a), presents an innovative attempt to address the lack of palaeobotanical data concerning ancient agricultural strategies in the northern Horn of Africa. In lieu of well-preserved macrobotanical remains, an especial problem for C4 crop species, these authors leverage microbotanical remains (phytoliths), in combination with ethnoarchaeologically-informed agroecology models to investigate finger millet and sorghum cultivation during the period of the Aksumite Kingdom (c. 50 BCE – 800 CE). Both finger millet and sorghum have played important roles in the subsistence of the Horn region, and throughout much of the rest of Africa and the world in the past. The importance of these drought-resistant and adaptable crops is likely to increase as we move into a warmer, drier world. Yet their histories of cultivation are still only approximately sketched due to a paucity of well-preserved remains from archaeological sites - for example, debate continues as to the precise centre of their domestication. Recent studies of phytoliths (by these and other authors) are demonstrating the likely continuous presence of these crops from the pre-Aksumite period. However, phytoliths are diagnostic only to broad taxonomic levels, and cannot be used to securely identify species. To supplement these observations, Ruiz-Giralt et al. deploy models (previously developed by this team: Ruiz-Giralt et al., 2023b) that incorporate environmental variables and ethnographic data on traditional agrosystems. They evaluate the feasibility of different agricultural regimes around the locations of numerous archaeological sites distributed across the highlands of northern Ethiopia and southern Eritrea. Their results indicate the general viability of finger millet and sorghum cultivation around archaeological settlements in the past, with various regions displaying greater-or-lesser suitability at different distances from the site itself. The models also highlight the likelihood of farmers utilising extensive-rainfed regimes, given low water and soil nutrient requirements for these crops. The authors discuss the results with respect to data on phytolith assemblages, particularly at the site of Ona Adi. They conclude that Aksumite agriculture very likely included the cultivation of finger millet and sorghum, as part of a broader system of rainfed cereal cultivation. Ruiz-Giralt et al. argue, and have demonstrated, that ethnoarchaeologically-informed models can be used to generate hypotheses to be evaluated against archaeological data. The integration of many diverse lines of information in this paper certainly enriches the discussion of agricultural possibilities in the past, and the use of a modelling framework helps to formalise the available hypotheses. However, they emphasise that modelling approaches cannot be pursued in lieu of rigorous archaeobotanical studies but only in tandem - a greater commitment to archaeobotanical sampling is required in the region if we are to fully detail the histories of these important crops. References Ruiz-Giralt, A., Beldados, A., Biagetti, S., D’Agostini, F., D’Andrea, A. C., Meresa, Y. and Lancelotti, C. (2023a). Sorghum and finger millet cultivation during the Aksumite period: insights from ethnoarchaeological modelling and microbotanical analysis. Zenodo, 7859673, ver. 3 peer-reviewed and recommended by Peer Community in Archaeology. https://doi.org/10.5281/zenodo.7859673 Ruiz-Giralt, A., Biagetti, S., Madella, M. and Lancelotti, C. (2023b). Small-scale farming in drylands: New models for resilient practices of millet and sorghum cultivation. PLoS ONE 18, e0268120. https://doi.org/10.1371/journal.pone.0268120
| Sorghum and finger millet cultivation during the Aksumite period: insights from ethnoarchaeological modelling and microbotanical analysis | Abel Ruiz-Giralt, Alemseged Beldados, Stefano Biagetti, Francesca D’Agostini, A. Catherine D’Andrea, Yemane Meresa, Carla Lancelotti | <p>For centuries, finger millet (<em>Eleusine coracana</em> Gaertn.) and sorghum (<em>Sorghum bicolor</em> (L.) Moench) have been two of the most economically important staple crops in the northern Horn of Africa. Nonetheless, their agricultural h... | | Africa, Archaeobotany, Computational archaeology, Protohistory, Spatial analysis | Emma Loftus | 2023-04-29 16:24:54 | ||
19 Feb 2024
Social Network Analysis of Ancient Japanese Obsidian Artifacts Reflecting Sampling Bias ReductionEvaluating Methods for Reducing Sampling Bias in Network AnalysisRecommended by James Allison based on reviews by Matthew Peeples and 1 anonymous reviewer
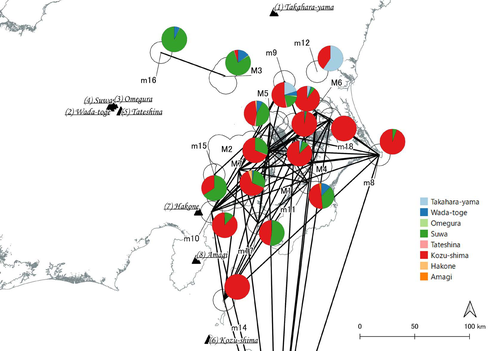
In a recent article, Fumihiro Sakahira and Hiro'omi Tsumura (2023) used social network analysis methods to analyze change in obsidian trade networks in Japan throughout the 13,000-year-long Jomon period. In the paper recommended here (Sakahira and Tsumura 2024), Social Network Analysis of Ancient Japanese Obsidian Artifacts Reflecting Sampling Bias Reduction they revisit that data and describe additional analyses that confirm the robustness of their social network analysis. The data, analysis methods, and substantive conclusions of the two papers overlap; what this new paper adds is a detailed examination of the data and methods, including use of bootstrap analysis to demonstrate the reasonableness of the methods they used to group sites into clusters. Both papers begin with a large dataset of approximately 21,000 artifacts from more than 250 sites dating to various times throughout the Jomon period. The number of sites and artifacts, varying sample sizes from the sites, as well as the length of the Jomon period, make interpretation of the data challenging. To help make the data easier to interpret and reduce problems with small sample sizes from some sites, the authors assign each site to one of five sub-periods, then define spatial clusters of sites within each period using the DBSCAN algorithm. Sites with at least three other sites within 10 km are joined into clusters, while sites that lack enough close neighbors are left as isolates. Clusters or isolated sites with sample sizes smaller than 30 were dropped, and the remaining sites and clusters became the nodes in the networks formed for each period, using cosine similarities of obsidian assemblages to define the strength of ties between clusters and sites. The main substantive result of Sakahira and Tsumura’s analysis is the demonstration that, during the Middle Jomon period (5500-4500 cal BP), clusters and isolated sites were much more connected than before or after that period. This is largely due to extensive distribution of obsidian from the Kozu-shima source, located on a small island off the Japanese mainland. Before the Middle Jomon period, Kozu-shima obsidian was mostly found at sites near the coast, but during the Middle Jomon, a trade network developed that took Kozu-shima obsidian far inland. This ended after the Middle Jomon period, and obsidian networks were less densely connected in the late and last Jomon periods. The methods and conclusions are all previously published (Sakahira and Tsumura 2023). What Sakahira and Tsumura add in Social Network Analysis of Ancient Japanese Obsidian Artifacts Reflecting Sampling Bias Reduction are: · an examination of the distribution of cosine similarities between their clusters for each period · a similar evaluation of the cosine similarities within each cluster (and among the unclustered sites) for each period · bootstrap analyses of the mean cosine similarities and network densities for each time period These additional analyses demonstrate that the methods used to cluster sites are reasonable, and that the use of spatially defined clusters as nodes (rather than the individual sites within the clusters) works well as a way of reducing bias from small, unrepresentative samples. An alternative way to reduce that bias would be to simply drop small assemblages, but that would mean ignoring data that could usefully contribute to the analysis. The cosine similarities between clusters show patterns that make sense given the results of the network analysis. The Middle Jomon period has, on average, the highest cosine similarities between clusters, and most cluster pairs have high cosine similarities, consistent with the densely connected, spatially expansive network from that time period. A few cluster pairs in the Middle Jomon have low similarities, apparently representing comparisons including one of the few nodes on the margins on the network that had little or no obsidian from the Kozu-shima source. The other four time periods all show lower average inter-cluster similarities and many cluster pairs have either high or low similarities. This probably reflects the tendency for nearby clusters to have very similar obsidian assemblages to each other and for geographically distant clusters to have dissimilar obsidian assemblages. The pattern is consistent with the less densely connected networks and regionalization shown in the network graphs. Thinking about this pattern makes me want to see a plot of the geographic distances between the clusters against the cosine similarities. There must be a very strong correlation, but it would be interesting to know whether there are any cluster pairs with similarities that deviate markedly from what would be predicted by their geographic separation. The similarities within clusters are also interesting. For each time period, almost every cluster has a higher average (mean and median) within-cluster similarity than the similarity for unclustered sites, with only two exceptions. This is partial validation of the method used for creating the spatial clusters; sites within the clusters are at least more similar to each other than unclustered sites are, suggesting that grouping them this way was reasonable. Although Sakahira and Tsumura say little about it, most clusters show quite a wide range of similarities between the site pairs they contain; average within-cluster similarities are relatively high, but many pairs of sites in most clusters appear to have low similarities (the individual values are not reported, but the pattern is clear in boxplots for the first four periods). There may be value in further exploring the occurrence of low site-to-site similarities within clusters. How often are they caused by small sample sizes? Clusters are retained in the analysis if they have a total of at least 30 artifacts, but clusters may contain sites with even smaller sample sizes, and small samples likely account for many of the low similarity values between sites in the same cluster. But is distance between sites in a cluster also a factor? If the most distant sites within a spatially extensive cluster are dissimilar, subdividing the cluster would likely improve the results. Further exploration of these within-cluster site-to-site similarity values might be worth doing, perhaps by plotting the similarities against the size of the smallest sample included in the comparison, as well as by plotting the cosine similarity against the distance between sites. Any low similarity values not attributable to small sample sizes or geographic distance would surely be worth investigating further. Sakahira and Tsumura also use a bootstrap analysis to simulate, for each time period, mean cosine similarities between clusters and between site pairs without clustering. They also simulate the network density for each time period before and after clustering. These analyses show that, almost always, mean simulated cosine similarities and mean simulated network density are higher after clustering than before. The simulated mean values also match the actual mean values better after clustering than before. This improved match to actual values when the sites are clustered for the bootstrap reinforces the argument that clustering the sites for the network analysis was a reasonable result. The strength of this paper is that Sakahira and Tsumura return to reevaluate their previously published work, which demonstrated strong patterns through time in the nature and extent of Jomon obsidian trade networks. In the current paper they present further analyses demonstrating that several of their methodological decisions were reasonable and their results are robust. The specific clusters formed with the DBSCAN algorithm may or may not be optimal (which would be unreasonable to expect), but the authors present analyses showing that using spatial clusters does improve their network analysis. Clustering reduces problems with small sample sizes from individual sites and simplifies the network graphs by reducing the number of nodes, which makes the results easier to interpret. Reference Sakahira, F. and Tsumura, H. (2023). Tipping Points of Ancient Japanese Jomon Trade Networks from Social Network Analyses of Obsidian Artifacts. Frontiers in Physics 10:1015870. https://doi.org/10.3389/fphy.2022.1015870 Sakahira, F. and Tsumura, H. (2024). Social Network Analysis of Ancient Japanese Obsidian Artifacts Reflecting Sampling Bias Reduction, Zenodo, 10057602, ver. 7 peer-reviewed and recommended by Peer Community in Archaeology. https://doi.org/10.5281/zenodo.7969330 | Social Network Analysis of Ancient Japanese Obsidian Artifacts Reflecting Sampling Bias Reduction | Fumihiro Sakahira, Hiro’omi Tsumura | <p>This study aims to investigate the dynamics of obsidian trade networks during the Jomon period (approximately 15,000 to 2,400 years ago), the hunting and gathering era in Japan. To improve regional representation and reduce the distortions caus... | | Asia, Computational archaeology | James Allison | Thegn Ladefoged, Matthew Peeples | 2023-05-28 05:51:12 | |
24 Jan 2024
Social Network Analysis, Community Detection Algorithms, and Neighbourhood Identification in PompeiiA Valuable Contribution to Archaeological Network Research: A Case Study of PompeiiRecommended by David Laguna-Palma based on reviews by Matthew Peeples, Isaac Ullah and Philip Verhagen
The paper entitled 'Social Network Analysis, Community Detection Algorithms, and Neighbourhood Identification in Pompeii' [1] presents a significant contribution to the field of archaeological network research, particularly in the challenging task of identifying urban neighborhoods within the context of Pompeii. This study focuses on the relational dynamics within urban neighborhoods and examines their indistinct boundaries through advanced analytical methods. The methodology employed provides a comprehensive analysis of community detection, including the Louvain and Leiden algorithms, and introduces a novel Convex Hull of Admissible Modularity Partitions (CHAMP) algorithm. The incorporation of a network approach into this domain is both innovative and timely. The potential impact of this research is substantial, offering new perspectives and analytical tools. This opens new avenues for understanding social structures in ancient urban settings, which can be applied to other archaeological contexts beyond Pompeii. Moreover, the manuscript is not only methodologically solid but also well-written and structured, making complex concepts accessible to a broad audience. In conclusion, this study represents a valuable contribution to the field of archaeology, particularly for archaeological network research. Their results not only enhance our knowledge of Pompeii but also provide a robust framework for future studies in similar historical contexts. Therefore, this publication advances our understanding of social dynamics in historical urban environments. The rigorous analysis, combined with the innovative application of network algorithms, makes this study a noteworthy addition to the existing body of network science literature. It is recommended for a wide range of scholars interested in the intersection of archaeology, history, and network science. Reference [1] Notarian, Matthew. 2024. Social Network Analysis, Community Detection Algorithms, and Neighbourhood Identification in Pompeii. https://doi.org/10.5281/zenodo.8305968 | Social Network Analysis, Community Detection Algorithms, and Neighbourhood Identification in Pompeii | Notarian, Matthew | <p>The definition and identification of urban neighbourhoods in archaeological contexts remain complex and problematic, both theoretically and empirically. As constructs with both social and spatial characteristics, their detection through materia... | | Antiquity, Classic, Computational archaeology, Mediterranean | David Laguna-Palma | 2023-08-31 19:28:35 | ||
02 Apr 2024
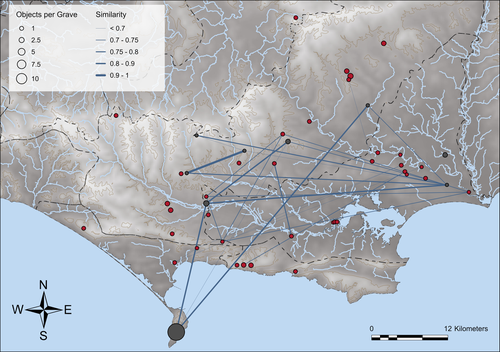
Similarity Network Fusion: Understanding Patterns and their Spatial Significance in Archaeological DatasetsA different approach to similarity networks in Archaeology - Similarity Network FusionRecommended by Joel Santos based on reviews by Matthew Peeples and 1 anonymous reviewerThis is a fascinating paper for anyone interested in network analysis or the chronology and cultures of the case study, namely the Late prehistoric burial sites in Dorset, for which the author’s approach allowed a new perspective over an already deeply studied area [1]. This paper's implementation of Similarity Network Fusion (SNF) is noteworthy. This method is typically utilized within genetic research but has yet to be employed in Archaeology. SNF has the potential to benefit Archaeology due to its unique capabilities and approach significantly. The author exhibits a deep and thorough understanding of previous investigations concerning material and similarity networks while emphasizing the innovative nature of this particular study. The SNF approach intends to improve a lack of the most used (in Archaeology) similarity coefficient, the Brainerd-Robinson, in certain situations, mainly in heterogenous and noisy datasets containing a small number of samples but a large number of measurements, scale differences, and collection biases, among other things. The SNF technique, demonstrated in the case study, effectively incorporates various similarity networks derived from different datatypes into one network. As shown during the Dorset case study, the SNF application has a great application in archaeology, even in already available data, allowing us to go further and bring new visions to the existing interpretations. As stated by the author, SNF shows its potential for other applications and fields in archaeology coping with similar datasets, such as archaeobotany or archaeozoology, and seems to complement different multivariate statistical approaches, such as correspondence or cluster analysis. This paper has been subject to two excellent revisions, which the author mostly accepted. One of the revisions was more technical, improving the article in the metadata part, data availability and clarification, etc. Although the second revision was more conceptual and gave some excellent technical inputs, it focused more on complementary aspects that will allow the paper to reach a wider audience. I vividly recommend its publication. References [1] Geitlinger, T. (2024). Similarity Network Fusion: Understanding Patterns and their Spatial Significance in Archaeological Datasets. Zenodo, 7998239, ver. 3 peer-reviewed and recommended by Peer Community in Archaeology. https://doi.org/10.5281/zenodo.7998239
| Similarity Network Fusion: Understanding Patterns and their Spatial Significance in Archaeological Datasets | Timo Geitlinger | <p>Since its earliest application in the 1970s, network analysis has become increasingly popular in both theoretical and GIS-based archaeology. Yet, applications of material networks remained relatively restricted. This paper describes a specific ... | | Computational archaeology, Protohistory | Joel Santos | 2023-06-02 16:51:19 | ||
05 Jun 2023

SEAHORS: Spatial Exploration of ArcHaeological Objects in R ShinyAnalyzing piece-plotted artifacts just got simpler: A good solution to the wrong problem?Recommended by Reuven Yeshurun based on reviews by Frédéric Santos, Jacqueline Meier and Maayan LevPaleolithic archaeologists habitually measure 3-coordinate data for artifacts in their excavations. This was first done manually, and in the last three decades it is usually performed by a total station and associated hardware. While the field recording procedure is quite straightforward, visualizing and analyzing the data are not, often requiring specialized proprietary software or coding expertise. Here, Royer and colleagues (2023) present the SEAHORS application, an elegant solution for the post-excavation analysis of artifact coordinate data that seems to be instantly useful for numerous archaeologists. SEAHORS allows one to import and organize field data (Cartesian coordinates and point description), which often comes in a variety of formats, and to create various density and distribution plots. It is specifically adapted to the needs of archaeologists, is free and accessible, and much simpler to use than many commercial programs. The authors further demonstrate the use of the application in the post-excavation analysis of the Cassenade Paleolithic site (see also Discamps et al., 2019). While in no way detracting from my appreciation of Royer et al.’s (2023) work, I would like to play the devil’s advocate by asking whether, in the majority of cases, field recording of artifacts in three coordinates is warranted. Royer et al. (2023) regard piece plotting as “…indispensable to propose reliable spatial planimetrical and stratigraphical interpretations” but this assertion does not hold in all (or most) cases, where careful stratigraphic excavation employing thin volumetric units would do just as well. Moreover, piece-plotting has some serious drawbacks. The recording often slows excavations considerably, beyond what is needed for carefully exposing and documenting the artifacts in their contexts, resulting in smaller horizontal and vertical exposures (e.g., Gilead, 2002). This typically hinders a fuller stratigraphic and contextual understanding of the excavated levels and features. Even worse, the method almost always creates a biased sample of “coordinated artifacts”, in which the most important items for understanding spatial patterns and site-formation processes – the small ones – are underrepresented. Some projects run the danger of treating the coordinated artifacts as bearing more significance than the sieve-recovered items, preferentially studying the former with no real justification. Finally, the coordinated items often go unassigned to a volumetric unit, effectively disconnecting them from other types of data found in the same depositional contexts. The advantages of piece-plotting may, in some cases, offset the disadvantages. But what I find missing in the general discourse (certainly not in the recommended preprint) is the “theory” behind the seemingly technical act of 3-coordinate recording (Yeshurun, 2022). Being in effect a form of sampling, this practice needs a rethink about where and how to be applied; what depositional contexts justify it, and what the goals are. These questions should determine if all “visible” artifacts are plotted, or just an explicitly defined sample of them (e.g., elongated items above a certain length threshold, which should be more reliable for fabric analysis), or whether the circumstances do not actually justify it. In the latter case, researchers sometimes opt for using “virtual coordinates” within in each spatial unit (typically 0.5x0.5 m), essentially replicating the data that is generated by “real” coordinates and integrating the sieve-recovered items as well. In either case, Royer et al.’s (2023) solution for plotting and visualizing labeled points within intra-site space would indeed be an important addition to the archaeologists’ tool kits.
References cited Discamps, E., Bachellerie, F., Baillet, M. and Sitzia, L. (2019). The use of spatial taphonomy for interpreting Pleistocene palimpsests: an interdisciplinary approach to the Châtelperronian and carnivore occupations at Cassenade (Dordogne, France). Paleoanthropology 2019, 362–388. https://doi.org/10.4207/PA.2019.ART136 Gilead, I. (2002). Too many notes? Virtual recording of artifacts provenance. In: Niccolucci, F. (Ed.). Virtual Archaeology: Proceedings of the VAST Euroconference, Arezzo 24–25 November 2000. BAR International Series 1075, Archaeopress, Oxford, pp. 41–44. Royer, A., Discamps, E., Plutniak, S. and Thomas, M. (2023). SEAHORS: Spatial Exploration of ArcHaeological Objects in R Shiny Zenodo, 7957154, ver. 2 peer-reviewed and recommended by Peer Community in Archaeology. https://doi.org/10.5281/zenodo.7929462 Yeshurun, R. (2022). Intra-site analysis of repeatedly occupied camps: Sacrificing “resolution” to get the story. In: Clark A.E., Gingerich J.A.M. (Eds.). Intrasite Spatial Analysis of Mobile and Semisedentary Peoples: Analytical Approaches to Reconstructing Occupation History. University of Utah Press, pp. 27–35.
| SEAHORS: Spatial Exploration of ArcHaeological Objects in R Shiny | ROYER, Aurélien, DISCAMPS, Emmanuel, PLUTNIAK, Sébastien, THOMAS, Marc | <p style="text-align: justify;">This paper presents SEAHORS, an R shiny application available as an R package, dedicated to the intra-site spatial analysis of piece-plotted archaeological remains. This open-source script generates 2D and 3D scatte... | | Computational archaeology, Spatial analysis, Theoretical archaeology | Reuven Yeshurun | 2023-02-24 16:01:44 | ||
31 Jan 2024
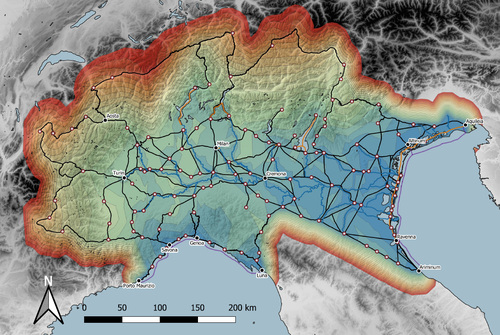
Rivers vs. Roads? A route network model of transport infrastructure in Northern Italy during the Roman periodModelling Roman Transport Infrastructure in Northern ItalyRecommended by Andrew McLean based on reviews by Pau de Soto and Adam PažoutStudies of the economy of the Roman Empire have become increasingly interdisciplinary and nuanced in recent years, allowing the discipline to make great strides in data collection and importantly in the methods through which this increasing volume of data can be effectively and meaningfully analysed [see for example 1 and 2]. One of the key aspects of modelling the ancient economy is understanding movement and transport costs, and how these facilitated trade, communication and economic development. With archaeologists adopting more computational techniques and utilising GIS analysis beyond simply creating maps for simple visualisation, understanding and modelling the costs of traversing archaeological landscapes has become a much more fruitful avenue of research. Classical archaeologists are often slower to adopt these new computational techniques than others in the discipline. This is despite (or perhaps due to) the huge wealth of data available and the long period of time over which the Roman economy developed, thrived and evolved. This all means that the Roman Empire is a particularly useful proving ground for testing and perfecting new methodological developments, as well as being a particularly informative period of study for understanding ancient human behaviour more broadly. This paper by Page [3] then, is well placed and part of a much needed and growing trend of Roman archaeologists adopting these computational approaches in their research. Page’s methodology builds upon De Soto’s earlier modelling of transport costs [4] and applies it in a new setting. This reflects an important practice which should be more widely adopted in archaeology. That of using existing, well documented methodologies in new contexts to offer wider comparisons. This allows existing methodologies to be perfected and tested more robustly without reinventing the wheel. Page does all this well, and not only builds upon De Soto’s work, but does so using a case study that is particularly interesting with convincing and significant results. As Page highlights, Northern Italy is often thought of as relatively isolated in terms of economic exchange and transport, largely due to the distance from the sea and the barriers posed by the Alps and Apennines. However, in analysing this region, and not taking such presumptions for granted, Page quite convincingly shows that the waterways of the region played an important role in bringing down the cost of transport and allowed the region to be far more interconnected with the wider Roman world than previous studies have assumed. This article is clearly a valuable and important contribution to our understanding of computational methods in archaeology as well as the economy and transport network of the Roman Empire. The article utilises innovative techniques to model transport in an area of the Roman Empire that is often overlooked, with the economic isolation of the area taken for granted. Having high quality research such as this specifically analysing the region using the most current methodologies is of great importance. Furthermore, developing and improving methodologies like this allow for different regions and case studies to be analysed and directly compared, in a way that more traditional analyses simply cannot do. As such, Page has demonstrated the importance of reanalysing traditional assumptions using the new data and analyses now available to archaeologists. References [1] Brughmans, T. and Wilson, A. (eds.) (2022). Simulating Roman Economies: Theories, Methods, and Computational Models. Oxford. [2] Dodd, E.K. and Van Limbergen, D. (eds.) (2024). Methods in Ancient Wine Archaeology: Scientific Approaches in Roman Contexts. London ; New York. [3] Page, J. (2024). Rivers vs. Roads? A route network model of transport infrastructure in Northern Italy during the Roman period, Zenodo, 7971399, ver. 3 peer-reviewed and recommended by Peer Community in Archaeology. https://doi.org/10.5281/zenodo.7971399 [4] De Soto P (2019). Network Analysis to Model and Analyse Roman Transport and Mobility. In: Finding the Limits of the Limes. Modelling Demography, Economy and Transport on the Edge of the Roman Empire. Ed. by Verhagen P, Joyce J, and Groenhuijzen M. Springer Open Access, pp. 271–90. https://doi.org/10.1007/978-3-030-04576-0_13 | Rivers vs. Roads? A route network model of transport infrastructure in Northern Italy during the Roman period | James Page | <p>Northern Italy has often been characterised as an isolated and marginal area during the Roman period, a region constricted by mountain ranges and its distance from major shipping lanes. Historians have frequently cited these obstacles, alongsid... | | Classic, Computational archaeology | Andrew McLean | 2023-05-28 15:11:31 |


